Role Type: Executive
Interactive Gartner Magic Quadrant for Analytics Trend Analysis
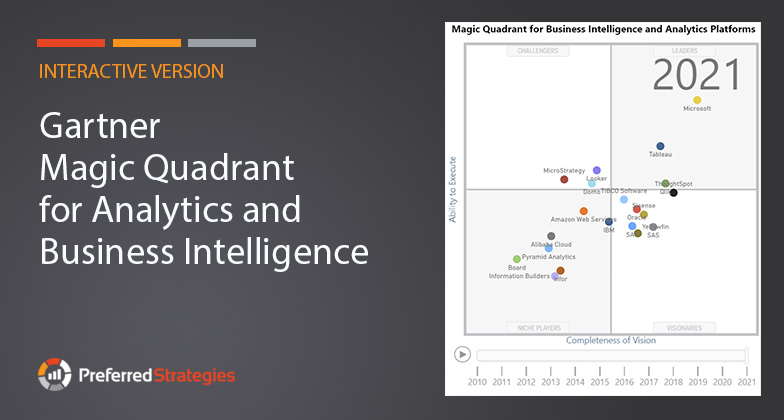
In this article we showcase an interactive version of the Gartner Magic Quadrant for Analytics and Business Intelligence (ABI) built using Microsoft’s Power BI platform. Using this interactive view of the data, you can see how vendors have trended over the past 11 years.
When to Pull the Plug on an Analytics Solution
Deciding to pull the plug on an Analytics Solution can be a difficult decision that many companies unduly postpone.
Power BI Updates for QuickLaunch Customers: 2020 in Review – Part 3 – Admins & Content Managers
In the third part of our 2020 in Review series, we cover new features and enhancements to the product designed to help users who are responsible for administering the usage, deployment, and adoption of Power BI within their organizations.
Power BI Updates for QuickLaunch Customers: 2020 in Review – Part 2 – Designers
Designing reports and dashboards in Power BI is exciting because things are constantly being upgraded to make your life easier and more interesting. The Power BI team releases updates for Power BI Desktop on a monthly cadence. In the second part of our 2020 in Review series, we will review some of our favorite updates for Power BI users that are responsible for creating reports and dashboards.
Power BI Updates for QuickLaunch Customers: 2020 in Review – Part 1 – Consumers
The Power BI team constantly rolls out new features and enhancements to the Power BI platform including updates to the Power BI Desktop, the Power BI Service, and the Power BI Mobile App. While it is awesome that Microsoft is committed to this continuous delivery strategy to quickly push updates into production, sometimes it can feel like drinking out of a firehose when trying to keep up with all the latest news.
First Quantum Uses Advanced Analytics to Predict COVID-19-Related Supply Shocks
First Quantum Minerals Ltd. (TSX:FM) is a global copper company that operates long life mines in several countries and employs approximately 20,000 people world-wide. First Quantum has an effective 90% ownership of Cobre Panama.
Embarking on the Journey to Become Data-Driven (CFMA Building Profits Article)
In our experience, many companies do not realize the need for a data-driven vision until an unforeseen event occurs. That event might be positive (a new revenue opportunity) or negative (a major cost over-run).
2020 Will See Modern BI & Self-Service Analytics Central to Digital Transformation Initiatives
If “Digital Transformation” was the watchword in 2019, it will be the driving force in 2020—and beyond. This year organizations continued to adopt policies and technologies in efforts to become increasingly data-driven and establish a “data culture” within their companies.
Preferred Strategies Introduces QuickLaunch for Viewpoint ERP
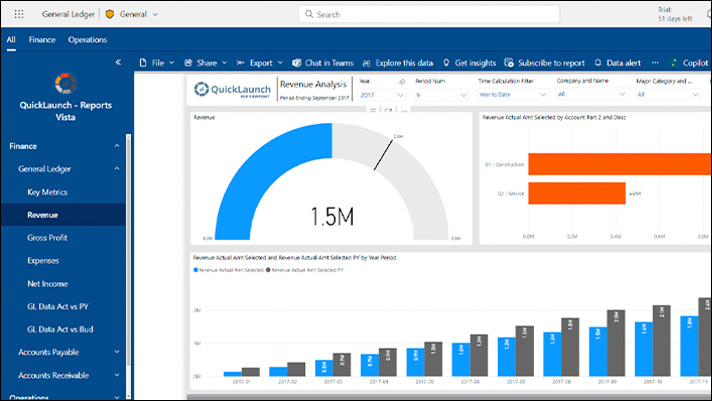
QuickLaunch for Viewpoint Vista extracts business impact from data and presents it in a meaningful way through Power BI to help construction company leadership and project managers to maximize the business value from their Viewpoint data.
Thanksgiving Visualized: The Holiday in Maps, Charts and Graphics
Once again we’ve curated some fun Thanksgiving-related articles and visualizations for your post-turkey reading. Enjoy!


