- Defining the time range to review items with shortages
- Deciding between stocking types like finished goods or raw material items
- Choosing relevant Branch Plants
- Selecting inventory sources to focus on, such as On Hand, Safety Stock, In Inspection, In Transit, Sales Order, Work Order, WO Parts List, Forecast, Work in Progress.
 Here’s example of the insights and actions our customers are gaining from this Supply and Demand Planning analysis:
- Identifying where and when shortages for an item will occur
- Determining what is driving the shortage
- Establishing when availability will be restored
- Analyze Work Order details for shortages and contact manufacturing departments to highlight anticipated problem and possible resolutions
- Identify and prioritize what products should have work orders submitted the soonest.
- Drill into Procurement details to identify what products the procurement team should prioritize ordering
 The Supply and Demand module can be customized to suit your company’s specific needs by giving you the flexibility to configure the core components of the solution. For example, you can set up whether Work Orders will be considered as a supply source before or after the order is released to the floor. Here’s a list of different elements that you can customize:
- Quantity – what quantity column from the ERP to use in calculations?
- Unit of Measure Conversions – what UOM do you use for your quantities?
- Projected Date - what date column from the ERP to use in calculations?
- Inclusion Rules – what transactions should be included from each of the source tables?
Optimize Payroll Processes with the New Payroll Detail Prospective
In the Viewpoint Vista ERP application, payroll transactions can be initiated in multiple sub-systems such as Job Cost, Equipment Maintenance, and Service Management. All those feed transactions to a payroll table in order to calculate deductions (like taxes) and liabilities (like vacation) in order to determine gross and net pay. The new payroll detail perspective in QuickLaunch provides a way to analyze company payroll data including straight time, overtime, gross pay, deductions, liabilities, and net pay. This allows aggregated and detailed analysis by a multitude of dimensions including employee, craft, class, pay type, department, job, equipment, service center, etc. This type of payroll analysis can help you with the identification of potentially missing payroll transactions (avoiding the expense of issuing a manual check) and duplicate payroll records (in the event a timecard was inadvertently entered twice). Research into payroll irregularities is much faster with a comprehensive enterprise data platform.Streamline Work Order Management with Equipment Work Orders and Preventative Maintenance
Until now, the QuickLaunch for Vista equipment perspective only included work order costs and hours for completed work. Our new Equipment Work Order and Preventative Maintenance perspective provides comprehensive insight into all work orders including future work orders (scheduled maintenance), current work orders (including those not started or assigned) and completed work orders. Work order activity can be analyzed by counts, backlog, assignments, department, category, component technician, item, etc. to balance workload and maximize productivity. This will enable you to compare estimated versus actual costs and hours to improve performance. Also, using extensive time-based measures, equipment managers will be able identify trends and outliers to manage and schedule assignments more effectively.Extend Asset Life with Equipment Warranty Enhancements
Out-of-the-box, Vista is good at identifying individual warranties on a single piece of equipment but that is the extent. The latest QuickLaunch for Vista release provides broader warranty analysis capabilities including identifying remaining warranty periods or miles. Warranty analysis by equipment, category, component, and vendor will enable you to reduce costs by optimizing product and warranty decisions. And best of all, the new warranty functionality is an integrated addition to the existing Equipment module.
Make your Audit Teams Happy with Our New Compliance Perspective
Vista stores compliance records in three separate tables; Vendor Compliance, Purchase Order Compliance, and Subcontract Compliance. Our compliance perspective merges these separate tables into one to provide a comprehensive view so that all compliance requirements and statuses for a vendor or contract can be seen in one glance. This single version of compliance truth will allow AP staff to resolve invoice hold inquiries quickly and will also allow project management staff to put pressure on subcontractors and vendors before their compliance status expires which leads to risk reduction.Sign Up for QuickLaunch for Vista 5.2 Release Notes Webinar
[post_title] => QuickLaunch for Vista Release Notes: Payroll Detail, Equipment Maintenance, Warranty Details and Much More! [post_excerpt] => We’re always looking to make improvements here at Preferred Strategies and lately, we’ve been busy! Vista Release Notes is our blog series that showcases recent product improvements to help you stay up to date on what’s new. [post_status] => publish [comment_status] => open [ping_status] => open [post_password] => [post_name] => vista-release-notes [to_ping] => [pinged] => [post_modified] => 2023-11-28 11:30:01 [post_modified_gmt] => 2023-11-28 19:30:01 [post_content_filtered] => [post_parent] => 0 [guid] => https://preferredstrategies.com/?p=10693 [menu_order] => 0 [post_type] => post [post_mime_type] => [comment_count] => 0 [filter] => raw ) [2] => WP_Post Object ( [ID] => 10429 [post_author] => 6 [post_date] => 2023-06-29 09:47:29 [post_date_gmt] => 2023-06-29 16:47:29 [post_content] => For both business users consuming insights through the Power BI Service and developers designing reports in the Power BI Desktop, the continuous innovation going on at Microsoft these days within the Power BI and Azure Analytics product groups means there's a lot of updates to keep track of. In this on-going series we will comb thru all of the latest updates and provide you with an overview of the most important features that are relevant to common enterprise analytics scenarios and deployments. We do this in the form of a live presentation with demos as well as a blog with mini recorded demos. Click here to watch the corresponding live education session recording.

Power BI Consumers
Power BI Goes Green
Late last year, Power BI announced that it would switch its application accent coloring from yellow to teal in order to make it more accessible for users with disabilities. This color coincidentally (or not) also matches the color scheme for the new Fabric platform announced last month that will include Power BI. More on that to come soon but if you have started to see the green Fabric logo in the Power BI Service…this is why. (click to view larger)
Subscribe to Personalized Views of Reports with Filters Applied
With the latest updates to the Subscribe feature, you can modify reports to be more relevant to yourself and then subscribe to that view. To do this, choose the Include my changes option in the Subscribe to emails window. This personalized view will include any of the following changes: filters, slicers, personalize visuals, cross-filtering or cross-highlighting, drill down or drill up, and spotlight. Read more (click to view larger)
Enhanced Integration Between Power BI and PowerPoint
In past iterations of this presentation/blog we showed you how you can embed Power BI reports into a presentation using the Power BI Add in for PowerPoint. Taking that a step further, you can now embed single visualizations that pertain to your slide. This allows people to easily make their presentations more interactive and informative. To do this simply click the Share option in the visual menu and then paste the provided link into the PBI Add in dialog box. Read more (click to view larger)

Power BI Designers
Quick Measure Suggestions (Preview Feature)
Building on the Quick Measures feature that was introduced a few years ago, the Power BI team has introduced natural language query technology into the fold to automatically generate DAX code suggestions to users. This accelerates the learning curve to get started with creating measures in Power BI and is a taste of what’s to come with Copilot generative AI features coming soon. This doesn’t mean that you don’t need to take some DAX classes or validate and test your measures in addition to having a formalized process for introducing these into your company’s centralized data model. Read more (click to view larger)
Enhanced Report Authoring with the Optimize Ribbon
With the new Optimize ribbon, report creators can improve both the development process and the consumer process through three new features that were combined with the Performance Analyzer feature. The first is the Pause visuals button which stops Power BI from sending queries while you are making changes to your report. Next up are Optimization Presets. These allow you to apply different settings combinations for Query Reduction, maximum Interactivity, or a custom blend of settings that works best for your needs. Lastly, the new ribbon allows you to add an Apply All Slicers button to a report that will turn off the visual refresh while users are making slicer value selections. These features are particularly useful for users who are working with very large datasets or a Direct Query report and need to optimize the user experience or for scenarios where consumers request many slicers which can slow down report performance. Read more (click to view larger)
Improvements to the Small Multiple Visual
The Small Multiple Visual was a great addition to the visualization suite in Power BI but it had a few gaps when released including making it more legible as you scaled the number of multiples. Fortunately, this has been addressed with the ability to unsynchronized the axes and scale each chart individually. This is accomplished by unsharing the y-axes and enabling the scale to fit option. Read more (click to view larger)
Create Dynamic Slicers with the New Field Parameter Feature
In the last iteration of this blog/presentation (link to blog), we demonstrated how you can use the Field Parameter feature in PBI to create dynamic visualizations and perform scenario analyses. With the latest update to this feature, you can now create dynamic slicers to allow users to slice by the values of the dimension parameter slicer. To do this you need to copy and paste the dimension parameter slicer and choose the option to show the values of the selected field in the field well. Read more (click to view larger)
Conditionally Format Visual Elements based on Text/String Fields
This is an exciting update because in the past the standard options only included support for numeric based conditional formatting and in order to accomplish this you had to do some fancy footwork in DAX adding new fields that linked string values to color codes. Now you just have to choose the format by Rules option and select the string field you want to use and list the value in the rule dialog box. Read more (click to view larger)
Smart Narrative Feature Built in for Visual Summaries
Power BI introduced its Natural Language Generation feature, Smart Narratives, a couple years ago but up until now you had to create a dedicated visual on your canvas to house this written analysis. However with this update you can enable your consumers to get these ML generated features on demand for each visual on your page to expose new insights. To enable for your report, simply click on the visual and then enable the Smart Narrative icon in the Format pane. Read moreUpdate to Page Navigator Visual
No more hiding and unhiding pages in your report! Now you can easily choose with pages to include or not include using the Pages section of the formatting pane. This feature is especially useful if you have a lot of pages in your report. Read more (click to view larger)
Enhance Your Visual Containers with New Subtitles, Dividers, Spacing and Padding Settings
In the last iteration of this blog/presentation (link to blog), we demonstrated how you can use the Field Parameter feature in PBI to create dynamic visualizations and perform scenario analyses. With the latest update to this feature, you can now create dynamic slicers to allow users to slice by the values of the dimension parameter slicer. To do this you need to copy and paste the dimension parameter slicer and choose the option to show the values of the selected field in the field well. Read more (click to view larger)

Power BI Admins & Content Managers
Paginated Reports Supported for Power BI Pro Workspaces
Before late last year, Paginated Reports were only supported in Premium workspaces but that restriction has been lifted and you can now publish these traditional operational style reports with a Pro license. In addition, there is a new migration tool as part of SQL Server 2022 that will help customers migrate SSRS reports to the Power BI Service which can help free up resources on your SQL server instances. These two updates should allow most companies to start using Paginated Reports alongside there interactive Power BI reports. Read more (click to view larger)
Allow Email Subscriptions to be Sent to External Users (Premium Feature)
If content is backed by either a Premium Capacity or Premium Per User license, users can set up subscriptions for external users that are not inside your company and haven’t been invited to your Azure AD B2B directory. You can control which users and security groups have access to this or to disable the feature in the tenant settings section of the Admin Portal. Read more (click to view larger)
Improved Way to Upload and Manage Power BI and Excel Files
There’s a new way to upload Power BI Excel files in Power BI and it’s much better. The UX has changed and now there is a drop down for Upload in the top of the workspace screen where you can choose to upload a file from Sharepoint or OneDrive for Business as well as Browsing your pc for a local file. The advantage of Sharepoint and OneDrive method is that your saved changes from PBI Desktop are saved automatically about every hour. Read more
(click to view larger)
Intro to Fabric and Enabling the new Fabric Platform for Your Tenant (Preview Feature)
Fabric is the new end-to-end cloud analytics platform from Microsoft that includes a Data Factory-powered data integration experience, Synapse-powered data engineering, data warehouse, data science, and real-time analytics experiences and business intelligence (BI) with Power BI; all connected to one data lake (OneLake) and delivered as a SaaS solution. Stay tuned for the next iteration of this PBI updates series where we will peel back the different layers of Fabric and discuss their readiness for enterprise analytics as well as provide demonstrations over QuickLaunch data. In the meantime, if you’re a PBI Admin, you can choose to turn on the Fabric platform preview for your tenant, by enabling the new corresponding tenant setting. If you don’t choose to opt out by July 1st, 2023, it will automatically be turned on. If you do opt out before then, it will stay off until you enable it. For customers running Power BI Premium capacities through P SKUs, the new Fabric experiences will not affect your resource usage on your capacity before August 1st, 2023. Starting in June, the Power BI Administrator Role will be renamed the Fabric Administrator to align with changing scope of new platform. Starting in June, the Power BI Free license will be renamed to the Microsoft Fabric (Free) license. Read more (click to view larger)
That wraps up this installment of the Power BI updates blog. Join us for Part 2 of this presentation on July 20th by registering here. If you're interested in checking out the Power BI feature release plan in an interactive Power BI report click here.
[post_title] => Power BI Updates for Enterprise Analytics: Q2 2023 - Part 1
[post_excerpt] => As we move towards the holiday season, let's review what the Power BI team has been up to over the summer and early fall of 2023.
[post_status] => publish
[comment_status] => closed
[ping_status] => open
[post_password] =>
[post_name] => power-bi-updates-q1-2023
[to_ping] =>
[pinged] =>
[post_modified] => 2023-08-18 09:04:25
[post_modified_gmt] => 2023-08-18 16:04:25
[post_content_filtered] =>
[post_parent] => 0
[guid] => https://preferredstrategies.com/bi-blog/power-bi-updates-q3-2021-copy/
[menu_order] => 0
[post_type] => post
[post_mime_type] =>
[comment_count] => 0
[filter] => raw
)
[3] => WP_Post Object
(
[ID] => 10258
[post_author] => 10
[post_date] => 2022-10-20 06:00:21
[post_date_gmt] => 2022-10-20 13:00:21
[post_content] => Many companies never touch the majority of the data they collect because it’s locked up deep in their Enterprise Resource Planning Data (ERP). ERP is software your organization can use to manage its day-to-day business activities. These activities include accounting, project management, compliance, procurement, risk management, and supply chain operations.
Your ERP can track activities that naturally occur in your business. This software can coordinate the flow between all these activities with the data it collects, often in real-time. Most companies' ERP collects information that can increase productivity, cut costs, and identify bottlenecks, and they are not utilizing it. Join us as we discuss how you can get more out of your ERP system.
(click to view larger)
That wraps up this installment of the Power BI updates blog. Join us for Part 2 of this presentation on July 20th by registering here. If you're interested in checking out the Power BI feature release plan in an interactive Power BI report click here.
[post_title] => Power BI Updates for Enterprise Analytics: Q2 2023 - Part 1
[post_excerpt] => As we move towards the holiday season, let's review what the Power BI team has been up to over the summer and early fall of 2023.
[post_status] => publish
[comment_status] => closed
[ping_status] => open
[post_password] =>
[post_name] => power-bi-updates-q1-2023
[to_ping] =>
[pinged] =>
[post_modified] => 2023-08-18 09:04:25
[post_modified_gmt] => 2023-08-18 16:04:25
[post_content_filtered] =>
[post_parent] => 0
[guid] => https://preferredstrategies.com/bi-blog/power-bi-updates-q3-2021-copy/
[menu_order] => 0
[post_type] => post
[post_mime_type] =>
[comment_count] => 0
[filter] => raw
)
[3] => WP_Post Object
(
[ID] => 10258
[post_author] => 10
[post_date] => 2022-10-20 06:00:21
[post_date_gmt] => 2022-10-20 13:00:21
[post_content] => Many companies never touch the majority of the data they collect because it’s locked up deep in their Enterprise Resource Planning Data (ERP). ERP is software your organization can use to manage its day-to-day business activities. These activities include accounting, project management, compliance, procurement, risk management, and supply chain operations.
Your ERP can track activities that naturally occur in your business. This software can coordinate the flow between all these activities with the data it collects, often in real-time. Most companies' ERP collects information that can increase productivity, cut costs, and identify bottlenecks, and they are not utilizing it. Join us as we discuss how you can get more out of your ERP system.
ERP Data Management
Your ERP data, no matter how complex, can be transformed into decision-ready information so you can make business decisions faster and with more confidence. You can utilize analytics and reporting platforms to easily access, transform, and provide a foundation for deep reporting. And it can easily integrate with various other software programs you use and analyze your ERP data (as well as CRM).How an ERP Can Monitor Your Business
If your business is collecting data from numerous departments within the company, your ERP is your best resource for truly understanding the health of your organization. Instead of running around trying to figure out where each department of your organization is struggling, you can look at the ERP system. It allows you to display the overall picture of your business in one dashboard. Financially, this tool can let you know where your business needs to be focusing more attention and where you’re wasting your time and resources. It is important to note that when using your ERP software, you want to ensure you have proper security measures. The last thing you want is a cybercriminal hacking into your system and using this valuable information against you. So, ensure any data you are collecting from external sources is checked before entering the system.ERP Example
Oracle has a great example of how a company can use ERP data to benefit their business. In their example, they look at a company that builds cars by procuring parts from multiple suppliers. This company can use its ERP system to track those purchases and ensure each component across the procure-to-pay process uses clean and uniform data connected to workflows, reporting, processes, and analytics. The data from the ERP system allows the company to run smoother, faster, and more cost-efficient by always knowing what is in process.How to Utilize ERP Analytics
With your ERP software, your business can collect and analyze data from internal activities. While collecting large amounts of data is great, a problem can arise when so much information is being collected. Without proper visualization software, your team can spend countless hours trying to pull data that is valuable. Plus, if you need these insights on a daily, weekly, or monthly basis, the money and time spent sifting through the information is not the best utilization of your resources. Investing in an analytics system to integrate with your ERP is vital to understanding your data. Analytics for your ERP takes the information received from various systems throughout your organization and streamlines it in real-time. It will compile all the information into a unified view allowing for easier collaboration throughout the entire business. You will no longer have to pull from multiple reports to paint a big picture; the picture is already framed for you and ready to go.Are You Utilizing Your ERP To Its Full Potential?
If you answered, I think so, or I don’t know, you most likely are not utilizing your ERP to its full potential. While your ERP is full of rich information, without visualization software like Power BI, it takes painstaking hours to gain the amazing insights that your ERP has to offer. If you want to talk specifics about how to get more out of your ERP, we encourage you to give us a call. Our team of hardworking, talented data junkies is dedicated to helping organizations turn their ERP (and CRM) data into decision-ready information. As a result, we help our clients gain the competitive advantage they need to make smarter business decisions, improve operational efficiencies, and increase profitability and overall revenue. Schedule A Call Today! [post_title] => ERP Data: Are You Using It or Just Collecting It? [post_excerpt] => [post_status] => publish [comment_status] => closed [ping_status] => open [post_password] => [post_name] => enterprise-resource-planning [to_ping] => [pinged] => [post_modified] => 2023-05-22 16:40:13 [post_modified_gmt] => 2023-05-22 23:40:13 [post_content_filtered] => [post_parent] => 0 [guid] => https://preferredstrategies.com/?p=10258 [menu_order] => 0 [post_type] => post [post_mime_type] => [comment_count] => 0 [filter] => raw ) [4] => WP_Post Object ( [ID] => 10252 [post_author] => 10 [post_date] => 2022-10-12 07:23:19 [post_date_gmt] => 2022-10-12 14:23:19 [post_content] =>Silicon Valley-based software reporting, analytics, and business intelligence company now offers a four-week trial offering of its signature product to JD Edwards users
Soquel, CA - Preferred Strategies, a leader in data transformation, modern business intelligence, and data analytics innovation, today announced its industry unique four-week trial offering of QuickLaunch Test Drive is now available. QuickLaunch Test Drive is designed to help forward-thinking companies running JD Edwards (JDE) learn how to improve the way data can be accessed and analyzed throughout their organization. It also allows these companies to experience how modern business intelligence (BI) technologies like Microsoft Power BI can work best when implemented over their own JDE data.Microsoft Power BI is consistently recognized as the “go to” platform in the marketplace. In the latest Gartner Magic Quadrant for Analytics and Business Intelligence (BI) Platforms, Power BI was the clear leader once again and Microsoft has been in the Leaders quadrant for the past 14 years. During the past six years, Power BI has been adopted by more than 250,000 organizations including 97 percent of Fortune 500 companies. For companies that already leverage Power BI, but haven’t harnessed its full potential, or those that are interested in experiencing its benefits for the first time, the QuickLaunch Test Drive program is a great place to start.
“If you run JDE as your ERP and want to know how successfully implementing a Modern BI, Reporting, and Analytics technology like Power BI will change the way your company thinks about and operates around data, the QuickLaunch Test Drive is perfect for you,” said Adam Crigger, Founder and President, Preferred Strategies. “As many companies lack the awareness of how Power BI can improve operational efficiencies, team-member satisfaction, and increase profitability, we wanted to find a way for customers to experience this for themselves and the QuickLaunch Test Drive does just that. During the trial, we will transform your JDE General Ledger and/or Sales data into actionable information, identify patterns in your data instantaneously, and shorten report development times.”
QuickLaunch Test Drive program participants will have access for up to four weeks. Throughout the program, Preferred Strategies will provide hands-on education workshops and working sessions for your report authors around Sales and/or General Ledger, and provide a preview and introduction for executives. Those who take advantage of the QuickLaunch Test Drive over their live JD Edwards data will experience firsthand the positive impact and transformation the Preferred Strategies solution can have on their operations and organization.
After the completion of the QuickLaunch Test Drive program, for a limited time, 100 percent of the set up fee will be credited back to the customer upon receipt of a signed agreement within 30-days after the program.
To understand what the QuickLaunch Test Drive program can do for your organization:
- Visit https://preferredstrategies.com/trial/
- email info@preferredstrategies.com
- or call 1-888-232-7337
About Preferred Strategies
Preferred Strategies was founded in 2002 by experienced JD Edwards business users and IT professionals. While working at a large construction materials and contracting company, Preferred Strategies’ Founder & President, Adam Crigger, experienced firsthand the difficulty in extracting data from JD Edwards and translating that data into meaningful reports and analytics. Today, Preferred Strategies is helping hundreds of JD Edwards, Viewpoint Vista, and Salesforce customers realize the full potential of their ERP and CRM data through the innovative Preferred Strategies QuickLaunch product. Combining decades of business and technical experience working with JD Edwards, NetSuite, Viewpoint Vista, and Salesforce data and modern reporting tools such as Microsoft® Power BI, QuickLaunch delivers the framework every customer needs to succeed on their data driven journey. For more information, visit http://www.preferredstrategies.com. [post_title] => Preferred Strategies Invites JD Edwards Users to Take a QuickLaunch Test Drive [post_excerpt] => Silicon Valley-based software reporting, analytics, and business intelligence company expands and enhances its QuickLaunch product line to meet increasing marketplace demand. [post_status] => publish [comment_status] => closed [ping_status] => open [post_password] => [post_name] => quicklaunch-test-drive-for-jde-users [to_ping] => [pinged] => [post_modified] => 2023-05-22 16:40:14 [post_modified_gmt] => 2023-05-22 23:40:14 [post_content_filtered] => [post_parent] => 0 [guid] => https://preferredstrategies.com/bi-blog/20-year-growth-copy/ [menu_order] => 0 [post_type] => post [post_mime_type] => [comment_count] => 0 [filter] => raw ) [5] => WP_Post Object ( [ID] => 10267 [post_author] => 10 [post_date] => 2022-10-06 06:00:05 [post_date_gmt] => 2022-10-06 13:00:05 [post_content] => How would you like to decrease the amount of money your organization spends? Or what about increasing productivity while having happy employees at the same time? It’s all possible if your organization is structured in a way that allows it to adapt to change. These days, most employees are experiencing burnout. Meanwhile, the power of technology to allow a business to grow is increasing every day. Unfortunately, this is causing an acceleration gap, meaning the difference between the pace of technology and the ability of companies to keep up is getting farther and farther apart. This is why it is so vital your organization adapts to change quickly.Adapting to Change
The COVID-19 pandemic is the most recent example of drastic change that happened nearly overnight. Those companies that were able to pivot made it through, but those that couldn’t, faltered. And let’s face it, most of us don’t like change. We resist it. But this is precisely why organizations need help, specifically when it comes to their data. Data is key. Organizations that utilize the data available are better equipped to adapt to change. To close the acceleration gap, businesses must make informed and strategic decisions. This will help them increase efficiency, cut labor costs, and gain valuable insights for future opportunities. Companies that can adapt to change are more profitable and more competitive. These are the companies that thrive. However, it’s not that simple. There are lots of software programs out there that can deliver data. What organizations really need is a program that can deliver the data and help the end-user interpret the data.Closing the Acceleration Gap
To close the digital acceleration gap and reap the rewards for your organization, you need to collect data and know how to interpret it. When correctly reading the data available to you, your organization will be able to:- Quickly pivot strategies (move from tactics that aren’t working to refocus on the ones that are)
- Reduce uncertainty, which will allow your employees to feel more confident in their work
- Evaluate performance (ROI)
- Operate in real-time
The Practice of Strategic Change
According to a recent Deloitte report, “Human nature makes it difficult to speed up the way individuals change. The way to create Organizational Acceleration is to fine-tune change at the organizational level.” The gist of the report is that change is always happening. That doesn’t just include change from the outside world, but internally. So how your organization deals with change will change too.Correctly Using Analytics
Data and analytics will allow you to see change happening in real-time. When you utilize the right tools, you can make more precise interpretations of the data you have. This can help you decrease the wasted time your employees spend going down one rabbit hole to the next. With proper analytics, your organization can better target the change it needs to close the acceleration gap. Then, as your company flexes its agility muscles, you’ll find it easier to pivot through all the changes life throws (such as a pandemic!).Change Starts at the Top
It may seem that the driving force for change and closing the acceleration gap begins with the employees; after all, they will likely be the ones reporting on what the data is telling them. However, for a company to truly adapt to change, it has to start with those at the top. Organizational leaders must be ready to take that data and run with it. They must accept that they will have to make changes quickly and help those working under them.How Preferred Strategies Can Help
If your company is ready to close the acceleration gap and adapt to change, Preferred Strategies can help. Our technology acceleration partners include Microsoft, Oracle, and Viewpoint, just to name a few. With our QuickLaunch Information Engine, we can interpret your ERP and CRM data, making your organization more efficient and profitable. Our “best in class” reporting and analytics tools help organizations realize the full value of their data within weeks. Start Adapting Today! [post_title] => The Acceleration Gap: Is Your Organization Adapting to Change [post_excerpt] => [post_status] => publish [comment_status] => closed [ping_status] => open [post_password] => [post_name] => acceleration-gap [to_ping] => [pinged] => [post_modified] => 2023-05-22 16:40:14 [post_modified_gmt] => 2023-05-22 23:40:14 [post_content_filtered] => [post_parent] => 0 [guid] => https://preferredstrategies.com/?p=10267 [menu_order] => 0 [post_type] => post [post_mime_type] => [comment_count] => 0 [filter] => raw ) [6] => WP_Post Object ( [ID] => 10223 [post_author] => 10 [post_date] => 2022-08-31 06:00:14 [post_date_gmt] => 2022-08-31 13:00:14 [post_content] => Effective organizational decision-making is reacting to what's currently happening in your business utilizing data analytics. For clarity, data analytics refers to modifying raw data into a usable format. But, as any business leader can attest, having easily accessible, insightful data from disparate sources often seems like a pipe dream. James Bradshaw of Ernst & Young states, "To be truly successful, organizational leadership must agree that data is an asset worth investing in. From the boardroom to the C-suite, this focus on data and analytics driving decision making is crucial." So, how do you untangle your data into the meaningful information you need to make informed, strategic business decisions? The answer: with Power BI.Business Intelligence with Power BI
Power BI is Microsoft's unified, scalable platform for self-service and enterprise business intelligence. An AI-powered program, Power BI connects to your various systems, allowing you to model and visualize your information into actionable, data-driven decisions. In other words, your raw data is modified into a usable format that informs effective strategic actions. Most importantly, with Power BI's ease of use, employees at all levels can be empowered to utilize analytics in their reporting, planning, and decision-making processes.One Version of Truth is Critical - Data Validated Across All Sources
To have total confidence in your business decisions, you need data that is validated across all your platforms. Data validation helps to weed out the outliers caused by issues such as manual data entry errors, which can be as high as 4%. Even with a leading analytics tool like Power BI, validating data across multiple sources is essential to be successful. Paring Power BI with a governed data model drives analytic efficiencies throughout the enterprise. Drawing from one version of truth enables a leaner approach to analytics and improves the consistency of information shared throughout your organization.Compelling Visualizations Foster Actionable Insights
Brian Hopkins, VP, Principal Analyst at Forrester shared, "In this emerging world of too much data, what matters most is how you discover and implement digital insight in the fabric of your business." With machine learning, Power BI analyzes information and draws conclusions. This AI forecasting, coupled with the compelling data visualization Power BI provides, enables companies to identify trends and anticipate challenges. Having easily accessible actionable insights means your organization can spot opportunities for improvement and transformation that lead to increased efficiency, reduced labor costs, and greater profitability and competitiveness.Real-Time Solutions Require Actionable Data
Receiving a report on Thursday afternoon that you didn't make a crucial delivery that morning only allows for reactive damage control. If you cannot identify and resolve problems before they happen, there is no strategic decision-making, only strategic apologizing. Having all the information you need at your fingertips in near real-time enables your team to pivot intelligently. Data visualization illuminates potential issues allowing organizations to adapt to fast-changing market conditions, uncertainties, and disruptions.Data Transformation for Profitability and Competitiveness
 We are in the decision-making business. If your organization is ready to invest in a true data transformation, our QuickLaunch Information Engine for Power BI will untangle all your data. Don't fall within the 70 to 80 percent of companies whose business intelligence initiatives fail. Preferred Strategies clients’ have a 96% success rate.
In today’s environment, business truly moves at the speed of light. Your access to your data needs to be as well in order to make actionable and timely decisions.
Let's Talk!
[post_title] => Organizational Decision-Making: Untangling Your Data with Power BI
[post_excerpt] =>
[post_status] => publish
[comment_status] => closed
[ping_status] => open
[post_password] =>
[post_name] => decision-making-with-power-bi
[to_ping] =>
[pinged] =>
[post_modified] => 2023-05-22 16:40:15
[post_modified_gmt] => 2023-05-22 23:40:15
[post_content_filtered] =>
[post_parent] => 0
[guid] => https://preferredstrategies.com/?p=10223
[menu_order] => 0
[post_type] => post
[post_mime_type] =>
[comment_count] => 0
[filter] => raw
)
[7] => WP_Post Object
(
[ID] => 10190
[post_author] => 2
[post_date] => 2022-08-03 13:47:26
[post_date_gmt] => 2022-08-03 20:47:26
[post_content] =>
[post_title] => Modern Transformation and Analytics Strategies with Power BI for JD Edwards
[post_excerpt] => To be successful in today’s competitive landscape, organizations need to maximize profits and customer satisfaction to ensure the company’s annual goals are successfully achieved. Each department must quickly adapt to the day-to-day business challenges to run efficiently and stay ahead of the quickly shifting and impactful business environment. As a result, companies are transitioning from legacy reporting applications to a Modern Analytics and BI platform like Power BI. Although Power BI is a user-friendly technology, companies often struggle to apply it to complex data sources like JD Edwards.
[post_status] => publish
[comment_status] => closed
[ping_status] => closed
[post_password] =>
[post_name] => modern-transformation-and-analytics-strategies-with-power-bi-for-jdedwards
[to_ping] =>
[pinged] =>
[post_modified] => 2022-10-11 10:02:26
[post_modified_gmt] => 2022-10-11 17:02:26
[post_content_filtered] =>
[post_parent] => 0
[guid] => https://preferredstrategies.com/resource/how-to-build-interactive-reports-with-quicklaunch-and-power-bi-copy/
[menu_order] => 0
[post_type] => resource
[post_mime_type] =>
[comment_count] => 0
[filter] => raw
)
[8] => WP_Post Object
(
[ID] => 10166
[post_author] => 2
[post_date] => 2022-07-22 16:23:29
[post_date_gmt] => 2022-07-22 16:23:29
[post_content] =>
[post_title] => How to Build Interactive Reports with QuickLaunch and Power BI
[post_excerpt] => There’s a goldmine of data inside your ERP and CRM systems. But do you have the right tools to transform this into decision-ready information?
Experience firsthand how to use modern BI tools to drive decision-making. Led by Preferred Strategies BI solutions consultant Michelle Werkmeister, you'll be expertly guided through a series of hands-on exercises and learn how to create your own reports for common business scenarios.
[post_status] => publish
[comment_status] => closed
[ping_status] => closed
[post_password] =>
[post_name] => how-to-build-interactive-reports-with-quicklaunch-and-power-bi
[to_ping] =>
[pinged] =>
[post_modified] => 2022-10-11 10:02:47
[post_modified_gmt] => 2022-10-11 17:02:47
[post_content_filtered] =>
[post_parent] => 0
[guid] => https://preferredstrategies.com/resource/learn-how-power-bi-resolves-daily-production-challenges-copy/
[menu_order] => 0
[post_type] => resource
[post_mime_type] =>
[comment_count] => 0
[filter] => raw
)
)
[post_count] => 9
[current_post] => -1
[before_loop] => 1
[in_the_loop] =>
[post] => WP_Post Object
(
[ID] => 11350
[post_author] => 6
[post_date] => 2024-06-19 23:02:45
[post_date_gmt] => 2024-06-20 06:02:45
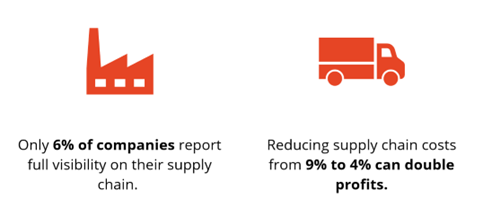
[post_content] => Today, according to Allied Market Research on Supply Chain Management, only 6% of companies claim to have full visibility into their supply chain. Furthermore, their 2023 report claims that organizations can double profits by reducing supply chain costs. This indicates that most companies can stand to make a lot more money if they are able to increase transparency through better access to supply chain information and more efficient processes.
We are in the decision-making business. If your organization is ready to invest in a true data transformation, our QuickLaunch Information Engine for Power BI will untangle all your data. Don't fall within the 70 to 80 percent of companies whose business intelligence initiatives fail. Preferred Strategies clients’ have a 96% success rate.
In today’s environment, business truly moves at the speed of light. Your access to your data needs to be as well in order to make actionable and timely decisions.
Let's Talk!
[post_title] => Organizational Decision-Making: Untangling Your Data with Power BI
[post_excerpt] =>
[post_status] => publish
[comment_status] => closed
[ping_status] => open
[post_password] =>
[post_name] => decision-making-with-power-bi
[to_ping] =>
[pinged] =>
[post_modified] => 2023-05-22 16:40:15
[post_modified_gmt] => 2023-05-22 23:40:15
[post_content_filtered] =>
[post_parent] => 0
[guid] => https://preferredstrategies.com/?p=10223
[menu_order] => 0
[post_type] => post
[post_mime_type] =>
[comment_count] => 0
[filter] => raw
)
[7] => WP_Post Object
(
[ID] => 10190
[post_author] => 2
[post_date] => 2022-08-03 13:47:26
[post_date_gmt] => 2022-08-03 20:47:26
[post_content] =>
[post_title] => Modern Transformation and Analytics Strategies with Power BI for JD Edwards
[post_excerpt] => To be successful in today’s competitive landscape, organizations need to maximize profits and customer satisfaction to ensure the company’s annual goals are successfully achieved. Each department must quickly adapt to the day-to-day business challenges to run efficiently and stay ahead of the quickly shifting and impactful business environment. As a result, companies are transitioning from legacy reporting applications to a Modern Analytics and BI platform like Power BI. Although Power BI is a user-friendly technology, companies often struggle to apply it to complex data sources like JD Edwards.
[post_status] => publish
[comment_status] => closed
[ping_status] => closed
[post_password] =>
[post_name] => modern-transformation-and-analytics-strategies-with-power-bi-for-jdedwards
[to_ping] =>
[pinged] =>
[post_modified] => 2022-10-11 10:02:26
[post_modified_gmt] => 2022-10-11 17:02:26
[post_content_filtered] =>
[post_parent] => 0
[guid] => https://preferredstrategies.com/resource/how-to-build-interactive-reports-with-quicklaunch-and-power-bi-copy/
[menu_order] => 0
[post_type] => resource
[post_mime_type] =>
[comment_count] => 0
[filter] => raw
)
[8] => WP_Post Object
(
[ID] => 10166
[post_author] => 2
[post_date] => 2022-07-22 16:23:29
[post_date_gmt] => 2022-07-22 16:23:29
[post_content] =>
[post_title] => How to Build Interactive Reports with QuickLaunch and Power BI
[post_excerpt] => There’s a goldmine of data inside your ERP and CRM systems. But do you have the right tools to transform this into decision-ready information?
Experience firsthand how to use modern BI tools to drive decision-making. Led by Preferred Strategies BI solutions consultant Michelle Werkmeister, you'll be expertly guided through a series of hands-on exercises and learn how to create your own reports for common business scenarios.
[post_status] => publish
[comment_status] => closed
[ping_status] => closed
[post_password] =>
[post_name] => how-to-build-interactive-reports-with-quicklaunch-and-power-bi
[to_ping] =>
[pinged] =>
[post_modified] => 2022-10-11 10:02:47
[post_modified_gmt] => 2022-10-11 17:02:47
[post_content_filtered] =>
[post_parent] => 0
[guid] => https://preferredstrategies.com/resource/learn-how-power-bi-resolves-daily-production-challenges-copy/
[menu_order] => 0
[post_type] => resource
[post_mime_type] =>
[comment_count] => 0
[filter] => raw
)
)
[post_count] => 9
[current_post] => -1
[before_loop] => 1
[in_the_loop] =>
[post] => WP_Post Object
(
[ID] => 11350
[post_author] => 6
[post_date] => 2024-06-19 23:02:45
[post_date_gmt] => 2024-06-20 06:02:45
[post_content] => Today, according to Allied Market Research on Supply Chain Management, only 6% of companies claim to have full visibility into their supply chain. Furthermore, their 2023 report claims that organizations can double profits by reducing supply chain costs. This indicates that most companies can stand to make a lot more money if they are able to increase transparency through better access to supply chain information and more efficient processes.
 At Preferred Strategies, we’ve been helping manufacturing companies that run JD Edwards gain visibility into their supply chain processes since 2002 with our QuickLaunch for JDE solution. The latest QuickLaunch product release includes an innovative way for companies to improve inventory management by anticipating inventory shortages and making corrective actions before their supply chain is impacted further.
Watch the latest education session our CEO, Todd Wilson recently presented about JDE Supply and Demand Planning and his experiences as CIO of Clif Bar as they worked to optimize their Supply Chain process.
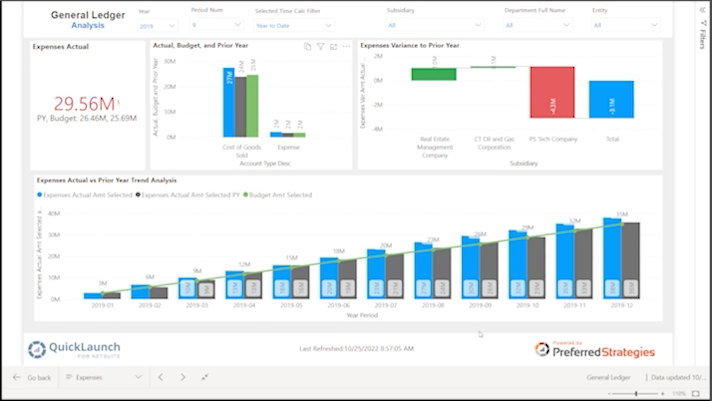
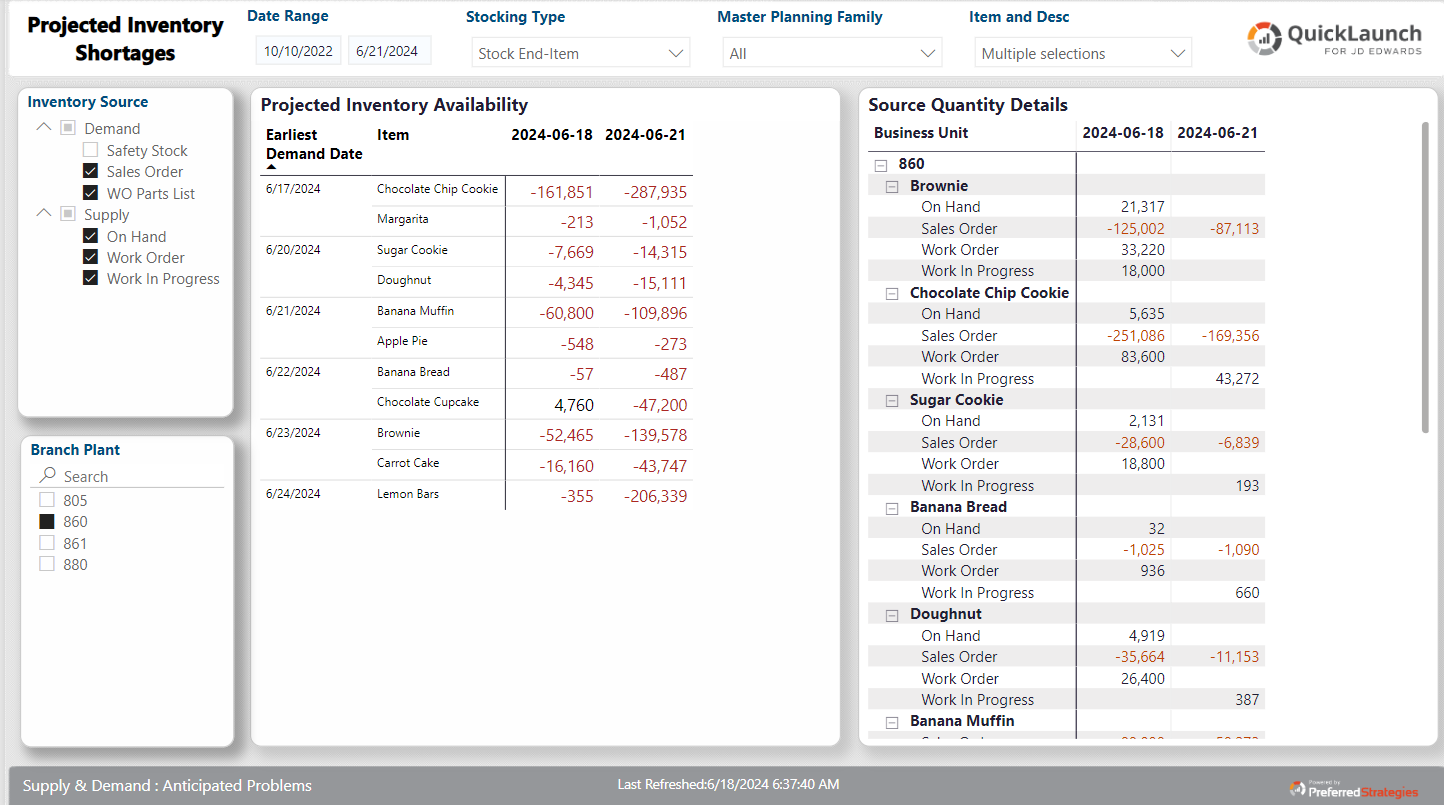
The QuickLaunch Supply & Demand Planning solution offers Material Planners a comprehensive tool to review inventory items and drill into details about inventory supply and demand sources, all within a single Power BI dashboard. The solution integrates JD Edwards Supply Chain data from the Inventory, Purchasing, Sales, Work Order Header, Work Order Parts List, and Work Order Router transaction tables and presents it back to business users in an easy-to-comprehend Power BI data model.
At Preferred Strategies, we’ve been helping manufacturing companies that run JD Edwards gain visibility into their supply chain processes since 2002 with our QuickLaunch for JDE solution. The latest QuickLaunch product release includes an innovative way for companies to improve inventory management by anticipating inventory shortages and making corrective actions before their supply chain is impacted further.
Watch the latest education session our CEO, Todd Wilson recently presented about JDE Supply and Demand Planning and his experiences as CIO of Clif Bar as they worked to optimize their Supply Chain process.
The QuickLaunch Supply & Demand Planning solution offers Material Planners a comprehensive tool to review inventory items and drill into details about inventory supply and demand sources, all within a single Power BI dashboard. The solution integrates JD Edwards Supply Chain data from the Inventory, Purchasing, Sales, Work Order Header, Work Order Parts List, and Work Order Router transaction tables and presents it back to business users in an easy-to-comprehend Power BI data model.
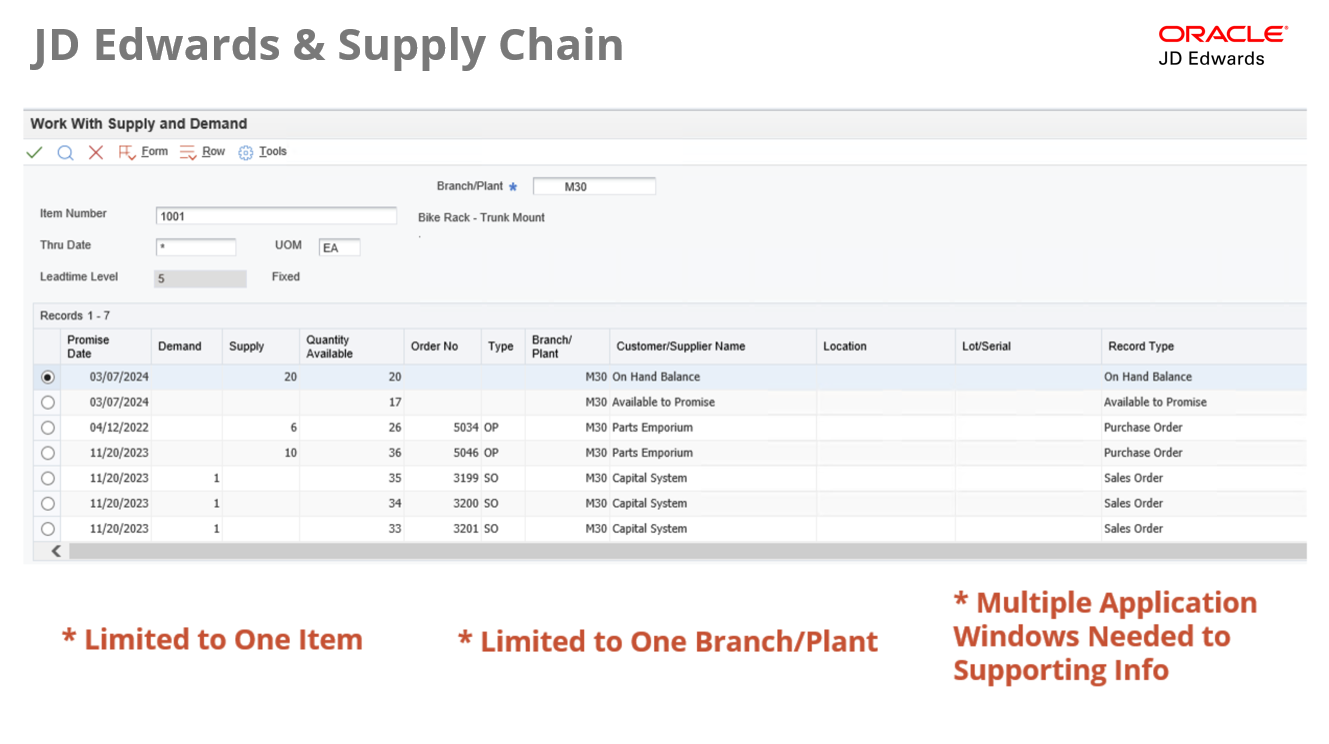
 Challenges with Native JDE Supply and Demand Reporting
The current release of JD Edwards only supports viewing one item at a time through the Supply & Demand Inquiry Application. In addition, users can only analyze one Branch/Plant at a time. This can make exception reporting very difficult as users will need to enter every product they manage for each branch, one by one, to try to spot any availability issues. Furthermore, additional JDE applications are needed to explore the supporting detailed data and what might be contributing to problems. This limitation makes identifying potential supply issues both difficult and time-consuming for business users to research and resolve.
Challenges with Native JDE Supply and Demand Reporting
The current release of JD Edwards only supports viewing one item at a time through the Supply & Demand Inquiry Application. In addition, users can only analyze one Branch/Plant at a time. This can make exception reporting very difficult as users will need to enter every product they manage for each branch, one by one, to try to spot any availability issues. Furthermore, additional JDE applications are needed to explore the supporting detailed data and what might be contributing to problems. This limitation makes identifying potential supply issues both difficult and time-consuming for business users to research and resolve.
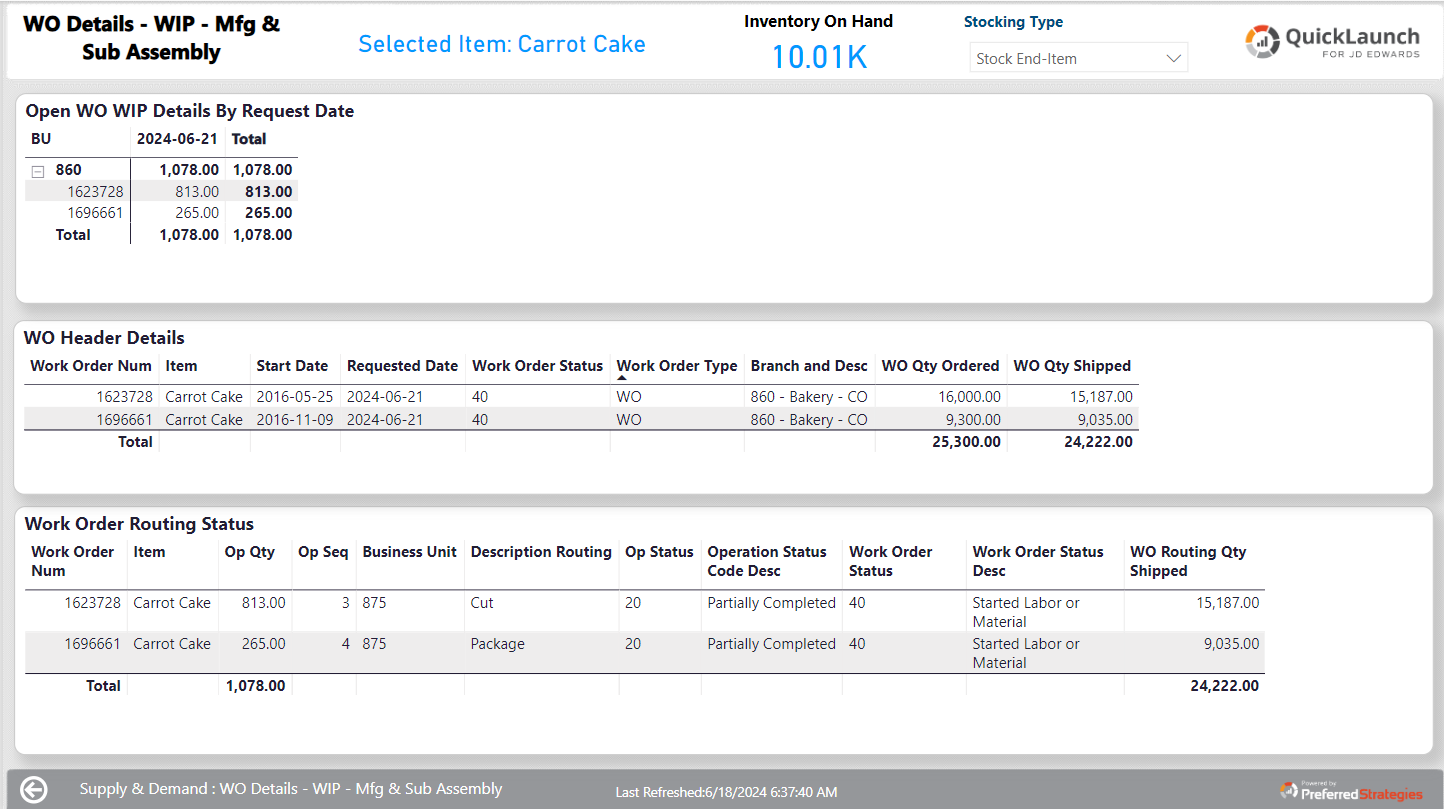
 Achieve Better Inventory Management with QuickLaunch
The QuickLaunch Supply & Demand Planning perspective empowers users to investigate inventory items with projected shortages inside an interactive Power BI dashboard pulling in the latest JDE data. With this solution, users can quickly refine the analysis by performing the following:
Achieve Better Inventory Management with QuickLaunch
The QuickLaunch Supply & Demand Planning perspective empowers users to investigate inventory items with projected shortages inside an interactive Power BI dashboard pulling in the latest JDE data. With this solution, users can quickly refine the analysis by performing the following:
- Defining the time range to review items with shortages
- Deciding between stocking types like finished goods or raw material items
- Choosing relevant Branch Plants
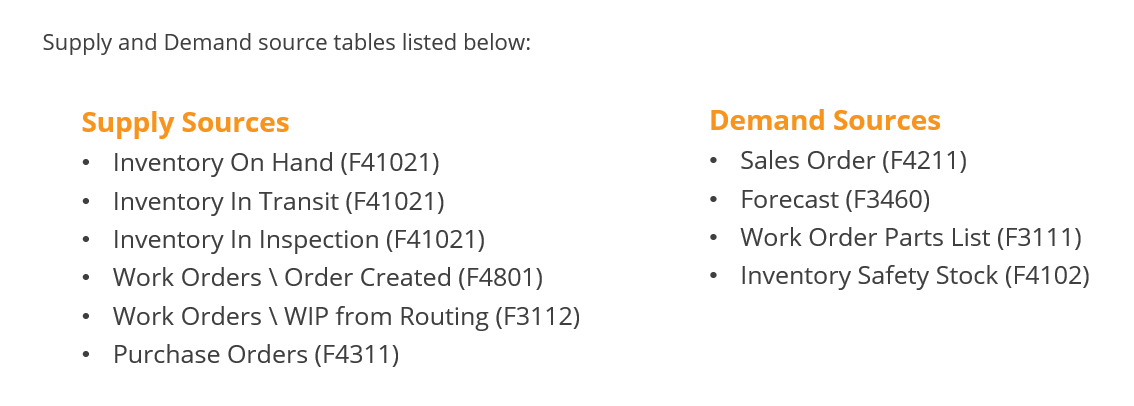
- Selecting inventory sources to focus on, such as On Hand, Safety Stock, In Inspection, In Transit, Sales Order, Work Order, WO Parts List, Forecast, Work in Progress.
Here’s example of the insights and actions our customers are gaining from this Supply and Demand Planning analysis:
- Identifying where and when shortages for an item will occur
- Determining what is driving the shortage
- Establishing when availability will be restored
- Analyze Work Order details for shortages and contact manufacturing departments to highlight anticipated problem and possible resolutions
- Identify and prioritize what products should have work orders submitted the soonest.
- Drill into Procurement details to identify what products the procurement team should prioritize ordering
The Supply and Demand module can be customized to suit your company’s specific needs by giving you the flexibility to configure the core components of the solution. For example, you can set up whether Work Orders will be considered as a supply source before or after the order is released to the floor. Here’s a list of different elements that you can customize:
- Quantity – what quantity column from the ERP to use in calculations?
- Unit of Measure Conversions – what UOM do you use for your quantities?
- Projected Date - what date column from the ERP to use in calculations?
- Inclusion Rules – what transactions should be included from each of the source tables?
Today, according to Allied Market Research on Supply Chain Management, only 6% of companies claim to have full visibility into their supply chain. Furthermore, their 2023 report claims that organizations can double profits by reducing supply chain costs. This indicates that most companies can stand to make a lot more money if they are able to increase transparency through better access to supply chain information and more efficient processes. At Preferred Strategies, we’ve been helping manufacturing companies that run JD Edwards gain visibility into their supply chain processes since 2002 with our QuickLaunch for JDE solution. The latest QuickLaunch product

We’re always looking to make improvements here at Preferred Strategies and lately, we’ve been busy! Vista Release Notes is our blog series that showcases recent product improvements to help you stay up to date on what’s new.

As we move towards the holiday season, let’s review what the Power BI team has been up to over the summer and early fall of 2023.

Many companies never touch the majority of the data they collect because it’s locked up deep in their Enterprise Resource Planning Data (ERP). ERP is software your organization can use to manage its day-to-day business activities. These activities include accounting, project management, compliance, procurement, risk management, and supply chain operations. Your ERP can track activities that naturally occur in your business. This software can coordinate the flow between all these activities with the data it collects, often in real-time. Most companies’ ERP collects information that can increase productivity, cut costs, and identify bottlenecks, and they are not utilizing it. Join
Silicon Valley-based software reporting, analytics, and business intelligence company expands and enhances its QuickLaunch product line to meet increasing marketplace demand.

How would you like to decrease the amount of money your organization spends? Or what about increasing productivity while having happy employees at the same time? It’s all possible if your organization is structured in a way that allows it to adapt to change. These days, most employees are experiencing burnout. Meanwhile, the power of technology to allow a business to grow is increasing every day. Unfortunately, this is causing an acceleration gap, meaning the difference between the pace of technology and the ability of companies to keep up is getting farther and farther apart. This is why it is

Effective organizational decision-making is reacting to what’s currently happening in your business utilizing data analytics. For clarity, data analytics refers to modifying raw data into a usable format. But, as any business leader can attest, having easily accessible, insightful data from disparate sources often seems like a pipe dream. James Bradshaw of Ernst & Young states, “To be truly successful, organizational leadership must agree that data is an asset worth investing in. From the boardroom to the C-suite, this focus on data and analytics driving decision making is crucial.” So, how do you untangle your data into the meaningful information
To be successful in today’s competitive landscape, organizations need to maximize profits and customer satisfaction to ensure the company’s annual goals are successfully achieved. Each department must quickly adapt to the day-to-day business challenges to run efficiently and stay ahead of the quickly shifting and impactful business environment. As a result, companies are transitioning from legacy reporting applications to a Modern Analytics and BI platform like Power BI. Although Power BI is a user-friendly technology, companies often struggle to apply it to complex data sources like JD Edwards.

There’s a goldmine of data inside your ERP and CRM systems. But do you have the right tools to transform this into decision-ready information?
Experience firsthand how to use modern BI tools to drive decision-making. Led by Preferred Strategies BI solutions consultant Michelle Werkmeister, you’ll be expertly guided through a series of hands-on exercises and learn how to create your own reports for common business scenarios.
- of 13
- Next >