Author: David Kettinger
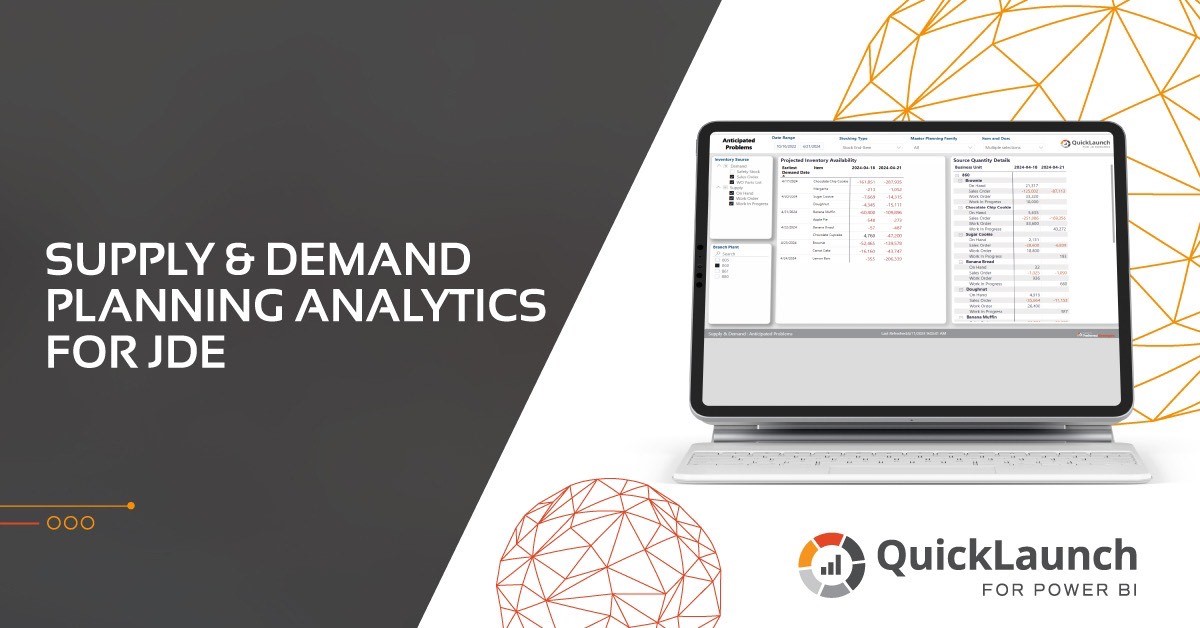
Maximize Efficiency with Supply and Demand Planning Analytics for JD Edwards
Today, according to Allied Market Research on Supply Chain Management, only 6% of companies claim to have full visibility into their supply chain. Furthermore, their 2023 report claims that organizations can double profits by reducing supply chain costs. This indicates that most companies can stand to make a lot more money if they are able to increase transparency through better access to supply chain information and more efficient processes. At Preferred Strategies, we’ve been helping manufacturing companies that run JD Edwards gain visibility into their supply chain processes since 2002 with our QuickLaunch for JDE solution. The latest QuickLaunch product
Power BI Updates for Enterprise Analytics: Q2 2023 – Part 1
As we move towards the holiday season, let’s review what the Power BI team has been up to over the summer and early fall of 2023.
Power BI Updates for QuickLaunch Customers: Q3 2021
As we move towards the holiday season, let’s review what the Power BI team has been up to over the summer and early fall of 2021.
Power BI Updates for QuickLaunch Customers: Q2 2021
The Power BI team has been releasing new features in full force. Q2 has seen a steady stream of updates to all areas of the platform.
Power BI Updates for QuickLaunch Customers: Q1 2021
Power BI was named a leader in the Gartner magic quadrant again this year. (Be sure to check out our interactive analysis of the Magic quadrant here.) A major factor of Power BI’s success has been the dedication by Microsoft to continuously improve the Power BI product suite with updates that are demand-driven and consistent.
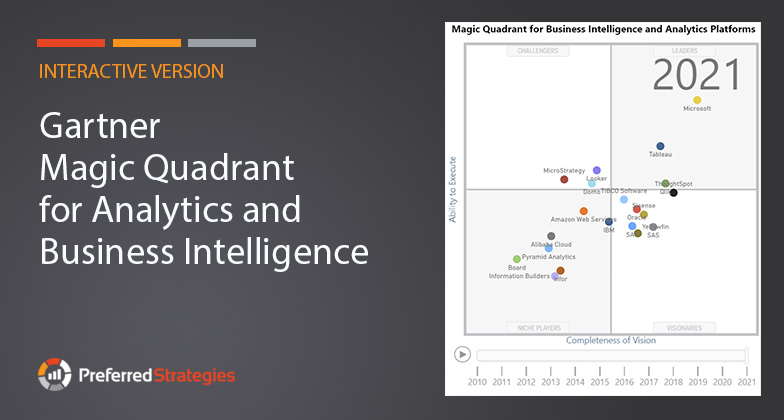
Interactive Gartner Magic Quadrant for Analytics Trend Analysis
In this article we showcase an interactive version of the Gartner Magic Quadrant for Analytics and Business Intelligence (ABI) built using Microsoft’s Power BI platform. Using this interactive view of the data, you can see how vendors have trended over the past 11 years.
Power BI Updates for QuickLaunch Customers: 2020 in Review – Part 3 – Admins & Content Managers
In the third part of our 2020 in Review series, we cover new features and enhancements to the product designed to help users who are responsible for administering the usage, deployment, and adoption of Power BI within their organizations.
Power BI Updates for QuickLaunch Customers: 2020 in Review – Part 2 – Designers
Designing reports and dashboards in Power BI is exciting because things are constantly being upgraded to make your life easier and more interesting. The Power BI team releases updates for Power BI Desktop on a monthly cadence. In the second part of our 2020 in Review series, we will review some of our favorite updates for Power BI users that are responsible for creating reports and dashboards.
Power BI Updates for QuickLaunch Customers: 2020 in Review – Part 1 – Consumers
The Power BI team constantly rolls out new features and enhancements to the Power BI platform including updates to the Power BI Desktop, the Power BI Service, and the Power BI Mobile App. While it is awesome that Microsoft is committed to this continuous delivery strategy to quickly push updates into production, sometimes it can feel like drinking out of a firehose when trying to keep up with all the latest news.

2020 Will See Modern BI & Self-Service Analytics Central to Digital Transformation Initiatives
If “Digital Transformation” was the watchword in 2019, it will be the driving force in 2020—and beyond. This year organizations continued to adopt policies and technologies in efforts to become increasingly data-driven and establish a “data culture” within their companies.