WP_Query Object
(
[query] => Array
(
[post_type] => Array
(
[0] => resource
[1] => post
)
[posts_per_page] => 9
[orderby] => publish_date
[order] => DESC
[paged] => 12
)
[query_vars] => Array
(
[post_type] => Array
(
[0] => resource
[1] => post
)
[posts_per_page] => 9
[orderby] => publish_date
[order] => DESC
[paged] => 12
[error] =>
[m] =>
[p] => 0
[post_parent] =>
[subpost] =>
[subpost_id] =>
[attachment] =>
[attachment_id] => 0
[name] =>
[pagename] =>
[page_id] => 0
[second] =>
[minute] =>
[hour] =>
[day] => 0
[monthnum] => 0
[year] => 0
[w] => 0
[category_name] =>
[tag] =>
[cat] =>
[tag_id] =>
[author] =>
[author_name] =>
[feed] =>
[tb] =>
[meta_key] =>
[meta_value] =>
[preview] =>
[s] =>
[sentence] =>
[title] =>
[fields] =>
[menu_order] =>
[embed] =>
[category__in] => Array
(
)
[category__not_in] => Array
(
)
[category__and] => Array
(
)
[post__in] => Array
(
)
[post__not_in] => Array
(
)
[post_name__in] => Array
(
)
[tag__in] => Array
(
)
[tag__not_in] => Array
(
)
[tag__and] => Array
(
)
[tag_slug__in] => Array
(
)
[tag_slug__and] => Array
(
)
[post_parent__in] => Array
(
)
[post_parent__not_in] => Array
(
)
[author__in] => Array
(
)
[author__not_in] => Array
(
)
[search_columns] => Array
(
)
[ignore_sticky_posts] =>
[suppress_filters] =>
[cache_results] => 1
[update_post_term_cache] => 1
[update_menu_item_cache] =>
[lazy_load_term_meta] => 1
[update_post_meta_cache] => 1
[nopaging] =>
[comments_per_page] => 50
[no_found_rows] =>
)
[tax_query] => WP_Tax_Query Object
(
[queries] => Array
(
)
[relation] => AND
[table_aliases:protected] => Array
(
)
[queried_terms] => Array
(
)
[primary_table] => wp_443ttgh517_posts
[primary_id_column] => ID
)
[meta_query] => WP_Meta_Query Object
(
[queries] => Array
(
)
[relation] =>
[meta_table] =>
[meta_id_column] =>
[primary_table] =>
[primary_id_column] =>
[table_aliases:protected] => Array
(
)
[clauses:protected] => Array
(
)
[has_or_relation:protected] =>
)
[date_query] =>
[request] => SELECT SQL_CALC_FOUND_ROWS wp_443ttgh517_posts.*
FROM wp_443ttgh517_posts
WHERE 1=1 AND ((wp_443ttgh517_posts.post_type = 'post' AND (wp_443ttgh517_posts.post_status = 'publish' OR wp_443ttgh517_posts.post_status = 'acf-disabled')) OR (wp_443ttgh517_posts.post_type = 'resource' AND (wp_443ttgh517_posts.post_status = 'publish' OR wp_443ttgh517_posts.post_status = 'acf-disabled')))
ORDER BY wp_443ttgh517_posts.post_date DESC
LIMIT 99, 9
[posts] => Array
(
[0] => WP_Post Object
(
[ID] => 3319
[post_author] => 6
[post_date] => 2017-12-13 18:29:46
[post_date_gmt] => 2017-12-14 02:29:46
[post_content] => Founded in 1964, Brasfield & Gorrie is one of the nation's largest privately held construction firms, providing general contracting, design-build, and construction management services for a wide variety of markets. Skilled in construction best practices, including virtual design and construction, integrated project delivery, and lean construction, Brasfield & Gorrie is best known for its preconstruction and self-perform expertise and exceptional client service. With annual revenues of approximately $2.8 billion, Brasfield & Gorrie has 12 offices and approximately 2,800 employees. Engineering News-Record ranks Brasfield & Gorrie 30th among the nation's "Top 400 Contractors" for 2017.
With the goal of making data more accessible and easier to comprehend through visualization, Brasfield & Gorrie deployed Preferred Strategies QuickLaunch for Power BI on JD Edwards. As a result, business users across the organization are now discovering the value of their corporate data. From finance to HR, to construction managers in the field, business users and executives now have easy access to data and the tools to visualize that data to make timely business decisions.
In any construction project, the need for total and complete efficiency and correct management practices is at number one, everyone involved needs to know what they are doing and how they are going to be doing it, with very little room for misinterpretation. This includes making sure that all safety measures are being taken, for instance, erecting the correctly labeled safety signs (www.seton.co.uk/safety-signs) in areas that need attention not only for the workers but for the general public too, this will help mitigate any potential accidents that could cause serious injury. One thing that can help along the process of construction is by implementing software that fits in with daily needs, for example, construction project management software from companies such as Rakenapp can bring everyone together and keep them on the same page. It reduces the need for paperwork and instead, has it digitally ready for when it is needed, making efficiency and preciseness at the forefront of any project.
To learn more about Brasfield & Gorrie's data journey, read the case study.
[post_title] => Brasfield & Gorrie Brings Data Innovation to Construction
[post_excerpt] => Founded in 1964, Brasfield & Gorrie is one of the nation’s largest privately held construction firms, providing general contracting, design-build, and construction management services for a wide variety of markets. Skilled in construction best practices, including virtual design and construction, integrated project delivery, and lean construction, Brasfield & Gorrie is best known for its preconstruction and self-perform expertise and exceptional client service.
[post_status] => publish
[comment_status] => closed
[ping_status] => open
[post_password] =>
[post_name] => brasfield-gorrie-brings-data-innovation-construction
[to_ping] =>
[pinged] =>
[post_modified] => 2021-06-18 23:00:18
[post_modified_gmt] => 2021-06-18 23:00:18
[post_content_filtered] =>
[post_parent] => 0
[guid] => https://preferredstrategies.com/?p=3319
[menu_order] => 23
[post_type] => post
[post_mime_type] =>
[comment_count] => 0
[filter] => raw
)
[1] => WP_Post Object
(
[ID] => 2959
[post_author] => 2
[post_date] => 2017-07-31 19:48:37
[post_date_gmt] => 2017-08-01 03:48:37
[post_content] => To Be a Data Driven Organization….You Need Access to Data
Founded in 1939, Mann Packing is an industry-leading supplier of premium fresh vegetables, and a strong proponent of the use of data and analytics to make business decisions. However, Mann was experiencing big challenges with its JD Edwards ERP reporting. The legacy reporting system was cumbersome and labor intensive—and completely unable to provide the data needed to run the business efficiently.
QuickLaunch to the Rescue
Mann Packing looked to Preferred Strategies to help solve their JDE data access problems. Preferred Strategies QuickLaunch™ simplifies back-end JD Edwards data environments to accelerate the implementation of market-leading business intelligence and visualization software, such as Microsoft(R) Power BI for Mann Packing. Preferred Strategies implemented QuickLaunch in the cloud, instantly translating the cryptic JD Edwards ERP data model into a business-friendly format for analysis in Power BI.
“This is nirvana!” said Jeff Cook, CFO of Mann Packing. “We accomplished more with QuickLaunch and Power BI in five hours than we have with other systems in years.”
Learn more about how Mann Packing is using QuickLaunch and Power BI to streamline JDE reporting and analytics. Read the full case study.
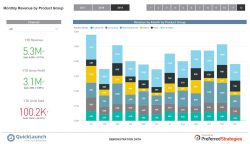 Sample dashboard visualizations show the richness of data that can be easily displayed from JDE with QuickLaunch for PowerBI
[post_title] => Mann Packing Streamlines Reporting & Analytics
[post_excerpt] => To Be a Data Driven Organization….You Need Access to Data Founded in 1939, Mann Packing is an industry-leading supplier of premium fresh vegetables, and a strong proponent of the use of data and analytics to make business decisions. However, Mann was experiencing big challenges with its JD Edwards ERP reporting.
[post_status] => publish
[comment_status] => closed
[ping_status] => open
[post_password] =>
[post_name] => mann-packing-streamlines-reporting-analytics
[to_ping] =>
[pinged] =>
[post_modified] => 2021-08-23 17:44:49
[post_modified_gmt] => 2021-08-23 17:44:49
[post_content_filtered] =>
[post_parent] => 0
[guid] => https://preferredstrategies.com/?p=2959
[menu_order] => 24
[post_type] => post
[post_mime_type] =>
[comment_count] => 0
[filter] => raw
)
[2] => WP_Post Object
(
[ID] => 2740
[post_author] => 6
[post_date] => 2017-03-22 17:34:33
[post_date_gmt] => 2017-03-23 01:34:33
[post_content] => Do you need traditional operational reports, interactive mobile reports, and/or analytical reports? What defines a Dashboard? Is it real-time or near-time?
Without the proper understanding and guidance, navigating the reporting and BI landscape can be challenging and in many cases, intimidating. As the definition and use-cases of Business Intelligence continuously changes, most JD Edwards customers struggle to keep up with the latest Reporting, Ad hoc Query and Analytics trends and best practices that their competitors are already using.
Modern data and enterprise reporting platforms are now combining traditional reporting features with powerful visualization capabilities, smart data discovery functionality, and advanced analytical tools enabling every business user to become a data analyst. Some companies make use of bespoke software for this, whilst others bring in parts of their platforms already in use to create an easy to navigate system via event-based architecture (with HTTPS://VANTIQ.COM/PLATFORM/ as one example). This shift from IT-centric reporting to modern business-led analytics has now become an industry norm according to Gartner's latest research for business intelligence and analytics platforms. Customer communication helps businesses keep going, they need to know their wants and needs and how they can help them with that. A cloud contact center solutions software can help businesses achieve this by communicating with their customers in the best way they can.
Access the full 2017 Gartner BI Magic Quadrant report provided by Microsoft here.
Join us on Thursday, March 23rd for an informative webinar that will give you a better understanding of how the latest technological trends can empower business users outside IT to gain immediate access to JD Edwards information in a format that is intuitive, easy to use, and automates current processes.
For your convenience we have created a Power BI report that can help you analyze the BI vendors over the past seven years by their completeness of vision and ability to execute.
For More Information:
Sources:
Microsoft - Gartner BI Magic Quadrant 2017
Created by David Kettinger | Business Intelligence Consultant & Web Enthusiast
[post_title] => Modern BI and Reporting Technology Trends Impacting JD Edwards Customers
[post_excerpt] => Do you need traditional operational reports, interactive mobile reports, and/or analytical reports? What defines a Dashboard? Is it real-time or near-time? Without the proper understanding and guidance, navigating the reporting and BI landscape can be challenging and in many cases, intimidating.
[post_status] => publish
[comment_status] => closed
[ping_status] => open
[post_password] =>
[post_name] => modern-bi-reporting-technology-trends-impacting-jd-edwards-customers
[to_ping] =>
[pinged] =>
[post_modified] => 2022-12-12 13:58:13
[post_modified_gmt] => 2022-12-12 21:58:13
[post_content_filtered] =>
[post_parent] => 0
[guid] => https://preferredstrategies.com/?p=2740
[menu_order] => 25
[post_type] => post
[post_mime_type] =>
[comment_count] => 0
[filter] => raw
)
[3] => WP_Post Object
(
[ID] => 2460
[post_author] => 6
[post_date] => 2016-11-02 00:03:45
[post_date_gmt] => 2016-11-02 08:03:45
[post_content] => Get hands-on with sample Power BI Job Cost reports for JD Edwards. Filter, drill-down, and analyze JD Edwards Job Cost data by job, business unit, and key metrics to spot trends and answer common business questions.
[post_title] => Hands-on Microsoft Power BI Job Cost Dashboard for JD Edwards
[post_excerpt] => Get hands-on with sample Power BI Job Cost reports for JD Edwards. Filter, drill-down, and analyze JD Edwards Job Cost data by job, business unit, and key metrics to spot trends and answer common business questions.
[post_status] => publish
[comment_status] => closed
[ping_status] => closed
[post_password] =>
[post_name] => hands-microsoft-power-bi-job-cost-dashboard-jd-edwards
[to_ping] =>
[pinged] =>
[post_modified] => 2021-06-24 22:55:02
[post_modified_gmt] => 2021-06-24 22:55:02
[post_content_filtered] =>
[post_parent] => 0
[guid] => https://preferredstrategies.com/?post_type=resource&p=2460
[menu_order] => 71
[post_type] => resource
[post_mime_type] =>
[comment_count] => 0
[filter] => raw
)
[4] => WP_Post Object
(
[ID] => 2168
[post_author] => 6
[post_date] => 2016-08-29 21:49:07
[post_date_gmt] => 2016-08-30 05:49:07
[post_content] => Are you looking for easy-to-use tools that provide actionable and interactive ways to analyze JD Edwards data? Attend this webinar to see how Microsoft’s latest tools make these objectives a reality.
The future of business intelligence (BI) does not lie on the shoulders of IT. Rather “modern” BI strategies must enable every business user to take advantage of familiar self-service software solutions to create, analyze, share, and consume actionable insights into organizational data without having to submit a help-desk ticket. In order to accomplish this, business users need analytics tools that provide real-time access to JDE data, are easy-to-use, powerful enough to handle the advanced needs of the business, integrated with JDE and other business applications, and cost-effective to meet the budget of any size organization.
In this demo-filled webinar you will discover the synergy between Microsoft Excel, Power BI and the entire Microsoft BI “stack”. Go under the hood of PowerBI, Microsoft’s latest Dashboard, Data Discovery and Visualization software designed for business users to develop their own interactive dashboards using drag and drop (ad hoc) functionality and natural language query technology. Users familiar with Excel and other Office software programs can quickly transfer their skills to building reports and visualizations with Power BI.
Whether or not you consider Microsoft Excel your best friend or worst enemy, it is still the most heavily used reporting and analytics software by companies today. With over 200 million users worldwide, the likely hood of this trend changing is minimal. Join us to see how to transition from spending tedious hours in Excel, to having your JD Edwards data updated and readily available to analyze in seconds with SSAS Tabular, PowerPivot, and Power BI models.
After this educational session you will learn how Microsoft has tightly integrated the underlying infrastructure of Excel and Power BI. Also, you will understand how the latest Microsoft technologies can enhance the effectiveness and impact of your business intelligence initiatives.
Attend this session to:
- Discover the benefits of the “In-memory” data modeling capabilities of PowerPivot and Tabular SSAS cube, which allow customers to analyze the results of millions of rows of JD Edwards data quickly and easily within Excel and Power BI
- Quickly and easily connect to JDE data using Excel and Power BI to analyze data and develop easy-to-consume visualizations that provide actionable insights
- Build “drag and drop” visualizations and dashboards over JD Edwards data in minutes with Microsoft Power BI
[post_title] => End Your JD Edwards Reporting Nightmares…Discover Why End Users Excel with Microsoft Power BI
[post_excerpt] => Are you looking for easy-to-use tools that provide actionable and interactive ways to analyze JD Edwards data? View this webinar recording to see why Microsoft Power BI is at the top of Gartner’s magic quadrant for BI and how you can use it along with other business applications like Excel to make the above objectives a reality.
[post_status] => publish
[comment_status] => closed
[ping_status] => closed
[post_password] =>
[post_name] => end-jd-edwards-reporting-nightmaresdiscover-end-users-excel-microsoft-power-bi
[to_ping] =>
[pinged] =>
[post_modified] => 2022-10-21 16:15:43
[post_modified_gmt] => 2022-10-21 23:15:43
[post_content_filtered] =>
[post_parent] => 0
[guid] => https://preferredstrategies.com/?post_type=resource&p=2168
[menu_order] => 76
[post_type] => resource
[post_mime_type] =>
[comment_count] => 0
[filter] => raw
)
[5] => WP_Post Object
(
[ID] => 2142
[post_author] => 6
[post_date] => 2016-08-27 00:06:05
[post_date_gmt] => 2016-08-27 08:06:05
[post_content] => Get hands-on with sample Power BI Manufacturing reports for JD Edwards. Filter, drill-down, and analyze JD Edwards production data by work order, item type, and important key metrics to spot trends and answer common business questions.
[post_title] => Hands-on Microsoft Power BI Manufacturing Work Order Dashboard for JD Edwards
[post_excerpt] => Would you like to analyze JD Edwards Manufacturing data on your own without IT assistance? Click to interact with the sample Power BI Work Order dashboard for JD Edwards.
[post_status] => publish
[comment_status] => closed
[ping_status] => closed
[post_password] =>
[post_name] => hands-microsoft-power-bi-manufacturing-work-order-dashboard-jd-edwards
[to_ping] =>
[pinged] =>
[post_modified] => 2021-06-25 19:01:45
[post_modified_gmt] => 2021-06-25 19:01:45
[post_content_filtered] =>
[post_parent] => 0
[guid] => https://preferredstrategies.com/?post_type=resource&p=2142
[menu_order] => 81
[post_type] => resource
[post_mime_type] =>
[comment_count] => 0
[filter] => raw
)
[6] => WP_Post Object
(
[ID] => 2139
[post_author] => 6
[post_date] => 2016-08-26 23:50:22
[post_date_gmt] => 2016-08-27 07:50:22
[post_content] => Get hands-on with sample Power BI Inventory reports for JD Edwards. Filter, drill-down, and analyze JD Edwards inventory data by business unit, product categories, and items to spot trends and answer common business questions.
[post_title] => Hands-on Microsoft Power BI Inventory Dashboard for JD Edwards
[post_excerpt] => Would you like to analyze JD Edwards Inventory data on your own without IT assistance? Click to interact with the sample Power BI Inventory dashboard for JD Edwards.
[post_status] => publish
[comment_status] => closed
[ping_status] => closed
[post_password] =>
[post_name] => hands-microsoft-power-bi-inventory-dashboard-jd-edwards
[to_ping] =>
[pinged] =>
[post_modified] => 2021-06-25 19:03:03
[post_modified_gmt] => 2021-06-25 19:03:03
[post_content_filtered] =>
[post_parent] => 0
[guid] => https://preferredstrategies.com/?post_type=resource&p=2139
[menu_order] => 82
[post_type] => resource
[post_mime_type] =>
[comment_count] => 0
[filter] => raw
)
[7] => WP_Post Object
(
[ID] => 2126
[post_author] => 6
[post_date] => 2016-08-26 19:09:00
[post_date_gmt] => 2016-08-27 03:09:00
[post_content] => Get hands-on with sample Power BI Accounts Receivable reports for JD Edwards. Filter, drill-down, and analyze JD Edwards AR data by aging group, customer, and key metrics to spot trends and answer common business questions.
[post_title] => Hands-on Microsoft Power BI Accounts Receivable Dashboard for JD Edwards
[post_excerpt] => Would you like to analyze JD Edwards AR data on your own without IT assistance? Click to interact with the sample Power BI Accounts Receivable dashboard for JD Edwards.
[post_status] => publish
[comment_status] => closed
[ping_status] => closed
[post_password] =>
[post_name] => hands-microsoft-power-bi-accounts-receivable-dashboard-jd-edwards
[to_ping] =>
[pinged] =>
[post_modified] => 2021-06-25 19:07:38
[post_modified_gmt] => 2021-06-25 19:07:38
[post_content_filtered] =>
[post_parent] => 0
[guid] => https://preferredstrategies.com/?post_type=resource&p=2126
[menu_order] => 79
[post_type] => resource
[post_mime_type] =>
[comment_count] => 0
[filter] => raw
)
[8] => WP_Post Object
(
[ID] => 2116
[post_author] => 6
[post_date] => 2016-08-26 17:59:53
[post_date_gmt] => 2016-08-27 01:59:53
[post_content] => Get hands-on with sample Power BI Accounts Payable reports for JD Edwards. Filter, drill-down, and analyze JD Edwards AP data by company, supplier, and key metrics to spot trends and answer common business questions.
[post_title] => Hands-on Microsoft Power BI Accounts Payable Dashboard for JD Edwards
[post_excerpt] => Would you like to analyze JD Edwards AP data on your own without IT assistance? Click to interact with the sample Power BI Accounts Payable dashboard for JD Edwards.
[post_status] => publish
[comment_status] => closed
[ping_status] => closed
[post_password] =>
[post_name] => hands-microsoft-power-bi-accounts-payable-dashboard-jd-edwards
[to_ping] =>
[pinged] =>
[post_modified] => 2021-06-25 19:07:56
[post_modified_gmt] => 2021-06-25 19:07:56
[post_content_filtered] =>
[post_parent] => 0
[guid] => https://preferredstrategies.com/?post_type=resource&p=2116
[menu_order] => 80
[post_type] => resource
[post_mime_type] =>
[comment_count] => 0
[filter] => raw
)
)
[post_count] => 9
[current_post] => -1
[before_loop] => 1
[in_the_loop] =>
[post] => WP_Post Object
(
[ID] => 3319
[post_author] => 6
[post_date] => 2017-12-13 18:29:46
[post_date_gmt] => 2017-12-14 02:29:46
[post_content] => Founded in 1964, Brasfield & Gorrie is one of the nation's largest privately held construction firms, providing general contracting, design-build, and construction management services for a wide variety of markets. Skilled in construction best practices, including virtual design and construction, integrated project delivery, and lean construction, Brasfield & Gorrie is best known for its preconstruction and self-perform expertise and exceptional client service. With annual revenues of approximately $2.8 billion, Brasfield & Gorrie has 12 offices and approximately 2,800 employees. Engineering News-Record ranks Brasfield & Gorrie 30th among the nation's "Top 400 Contractors" for 2017.
With the goal of making data more accessible and easier to comprehend through visualization, Brasfield & Gorrie deployed Preferred Strategies QuickLaunch for Power BI on JD Edwards. As a result, business users across the organization are now discovering the value of their corporate data. From finance to HR, to construction managers in the field, business users and executives now have easy access to data and the tools to visualize that data to make timely business decisions.
In any construction project, the need for total and complete efficiency and correct management practices is at number one, everyone involved needs to know what they are doing and how they are going to be doing it, with very little room for misinterpretation. This includes making sure that all safety measures are being taken, for instance, erecting the correctly labeled safety signs (
www.seton.co.uk/safety-signs) in areas that need attention not only for the workers but for the general public too, this will help mitigate any potential accidents that could cause serious injury. One thing that can help along the process of construction is by implementing software that fits in with daily needs, for example,
construction project management software from companies such as Rakenapp can bring everyone together and keep them on the same page. It reduces the need for paperwork and instead, has it digitally ready for when it is needed, making efficiency and preciseness at the forefront of any project.
To learn more about Brasfield & Gorrie's data journey, read the
case study.
[post_title] => Brasfield & Gorrie Brings Data Innovation to Construction
[post_excerpt] => Founded in 1964, Brasfield & Gorrie is one of the nation’s largest privately held construction firms, providing general contracting, design-build, and construction management services for a wide variety of markets. Skilled in construction best practices, including virtual design and construction, integrated project delivery, and lean construction, Brasfield & Gorrie is best known for its preconstruction and self-perform expertise and exceptional client service.
[post_status] => publish
[comment_status] => closed
[ping_status] => open
[post_password] =>
[post_name] => brasfield-gorrie-brings-data-innovation-construction
[to_ping] =>
[pinged] =>
[post_modified] => 2021-06-18 23:00:18
[post_modified_gmt] => 2021-06-18 23:00:18
[post_content_filtered] =>
[post_parent] => 0
[guid] => https://preferredstrategies.com/?p=3319
[menu_order] => 23
[post_type] => post
[post_mime_type] =>
[comment_count] => 0
[filter] => raw
)
[comment_count] => 0
[current_comment] => -1
[found_posts] => 112
[max_num_pages] => 13
[max_num_comment_pages] => 0
[is_single] =>
[is_preview] =>
[is_page] =>
[is_archive] =>
[is_date] =>
[is_year] =>
[is_month] =>
[is_day] =>
[is_time] =>
[is_author] =>
[is_category] =>
[is_tag] =>
[is_tax] =>
[is_search] =>
[is_feed] =>
[is_comment_feed] =>
[is_trackback] =>
[is_home] => 1
[is_privacy_policy] =>
[is_404] =>
[is_embed] =>
[is_paged] => 1
[is_admin] =>
[is_attachment] =>
[is_singular] =>
[is_robots] =>
[is_favicon] =>
[is_posts_page] =>
[is_post_type_archive] =>
[query_vars_hash:WP_Query:private] => 57b0cc57bedd6d075b87571dc864cf30
[query_vars_changed:WP_Query:private] =>
[thumbnails_cached] =>
[allow_query_attachment_by_filename:protected] =>
[stopwords:WP_Query:private] =>
[compat_fields:WP_Query:private] => Array
(
[0] => query_vars_hash
[1] => query_vars_changed
)
[compat_methods:WP_Query:private] => Array
(
[0] => init_query_flags
[1] => parse_tax_query
)
)
Blog
Brasfield & Gorrie Brings Data Innovation to Construction
December 13, 2017
Founded in 1964, Brasfield & Gorrie is one of the nation’s largest privately held construction firms, providing general contracting, design-build, and construction management services for a wide variety of markets. Skilled in construction best practices, including virtual design and construction, integrated project delivery, and lean construction, Brasfield & Gorrie is best known for its preconstruction and self-perform expertise and exceptional client service.
Blog
Mann Packing Streamlines Reporting & Analytics
July 31, 2017
To Be a Data Driven Organization….You Need Access to Data Founded in 1939, Mann Packing is an industry-leading supplier of premium fresh vegetables, and a strong proponent of the use of data and analytics to make business decisions. However, Mann was experiencing big challenges with its JD Edwards ERP reporting.
