Do you need traditional operational reports, interactive mobile reports, and/or analytical reports? What defines a Dashboard? Is it real-time or near-time?
Without the proper understanding and guidance, navigating the reporting and BI landscape can be challenging and in many cases, intimidating. As the definition and use-cases of Business Intelligence continuously changes, most JD Edwards customers struggle to keep up with the latest Reporting, Ad hoc Query and Analytics trends and best practices that their competitors are already using.
Modern data and enterprise reporting platforms are now combining traditional reporting features with powerful visualization capabilities, smart data discovery functionality, and advanced analytical tools enabling every business user to become a data analyst. Some companies make use of bespoke software for this, whilst others bring in parts of their platforms already in use to create an easy to navigate system via event-based architecture (with HTTPS://VANTIQ.COM/PLATFORM/ as one example). This shift from IT-centric reporting to modern business-led analytics has now become an industry norm according to Gartner’s latest research for business intelligence and analytics platforms. Customer communication helps businesses keep going, they need to know their wants and needs and how they can help them with that. A cloud contact center solutions software can help businesses achieve this by communicating with their customers in the best way they can.
Access the full 2017 Gartner BI Magic Quadrant report provided by Microsoft here.
Join us on Thursday, March 23rd for an informative webinar that will give you a better understanding of how the latest technological trends can empower business users outside IT to gain immediate access to JD Edwards information in a format that is intuitive, easy to use, and automates current processes.
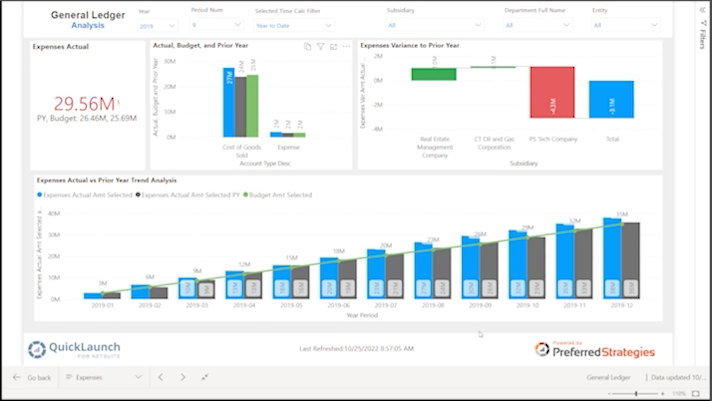
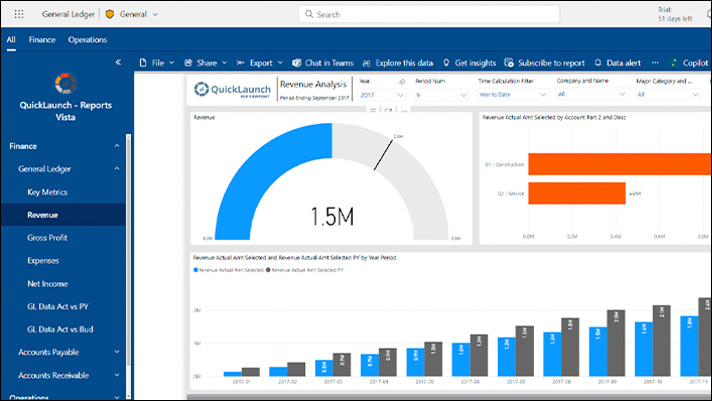
For your convenience we have created a Power BI report that can help you analyze the BI vendors over the past seven years by their completeness of vision and ability to execute.
For More Information:
Sources:
Microsoft – Gartner BI Magic Quadrant 2017
Created by David Kettinger | Business Intelligence Consultant & Web Enthusiast