- Posted record breaking increases in year-over-year customer base and revenue growth
- Reported 37 percent staff growth with more positions to fill in 2022
- Expanded QuickLaunch product line for Salesforce and NetSuite users
- Launched redesigned website showcasing unique features and benefits, updated QuickLaunch solutions, and extensive educational content.
- Announced an Employee Stock Ownership Plan (ESOP) as the first step towards its transition to becoming an employee-owned company
- Closed the year with a customer Net Promoter Score® of 74
- Earned an employee Net Promoter Score® (eNPS) of 92
About Preferred Strategies
Preferred Strategies was founded in 2002 by experienced JD Edwards business users and IT professionals. While working at a large construction materials and contracting company, Preferred Strategies’ Founder & President, Adam Crigger, experienced firsthand the difficulty in extracting data from JD Edwards and translating that data into meaningful reports and analytics. Today, Preferred Strategies is helping hundreds of JD Edwards and Viewpoint Vista customers to realize the full potential of their ERP data through the innovative Preferred Strategies QuickLaunch product. Combining decades of business and technical experience working with JD Edwards and Viewpoint Vista data and modern reporting tools such as Microsoft® Power BI, QuickLaunch delivers the framework every customer needs to succeed on their data driven journey. For more information, visit http://www.preferredstrategies.com. [post_title] => Preferred Strategies Celebrates 20th Anniversary by Closing 2021 with Record Increases in Customer Base and Annual Revenue Growth [post_excerpt] => Silicon Valley-based software reporting, analytics, and business intelligence company expands and enhances its QuickLaunch product line to meet increasing marketplace demand. [post_status] => publish [comment_status] => closed [ping_status] => open [post_password] => [post_name] => 20-year-growth [to_ping] => [pinged] => [post_modified] => 2023-05-22 16:40:15 [post_modified_gmt] => 2023-05-22 23:40:15 [post_content_filtered] => [post_parent] => 0 [guid] => https://preferredstrategies.com/bi-blog/ishift-preferred-strategies-partners-copy/ [menu_order] => 0 [post_type] => post [post_mime_type] => [comment_count] => 0 [filter] => raw ) [6] => WP_Post Object ( [ID] => 9685 [post_author] => 10 [post_date] => 2021-11-23 18:52:07 [post_date_gmt] => 2021-11-23 18:52:07 [post_content] => Scottsdale, AZ – iShift and Preferred Strategies have joined forces to seamlessly deliver an innovative cloud-based implementation of Preferred Strategies’ QuickLauch solution. Preferred Strategies has been an innovator and thought leader in the Business Intelligence and Data Analytics space for over 20 years. The QuickLaunch solution is an Information Engine designed to help companies access data that is hard to get to and understand, and turn it into useable information so employees and leaders are equipped to make better decisions that positively impact their business. The QuickLaunch framework is built on the Microsoft Power BI platform and offers cutting edge visualization and analytics functionality across all corporate data sources. The solution allows organizations to access and use their data as a strategic asset to make informed business decisions, increase efficiency, reduce labor costs and gain powerful insights to future opportunities that ultimately make their company more profitable and competitive. The iShift Platform is a comprehensive solution to guide businesses undergoing cloud migration. It encompasses a fully hosted and managed cloud environment and the stack of applications that meet the organization’s needs for value and profitability following the highest security standards, governance, and compliance with applicable regulatory requirements. When a Preferred Strategies client approached them for guidance on best practices in setting up a cloud-based deployment of QuickLaunch, Preferred Strategies brought in iShift as a strategic partner to advise, plan, and design the right Azure cloud environment. As a Microsoft Azure partner, iShift had the knowledge, certifications, and resources to plan and set up the right cloud infrastructure. As a result of the joint project, Preferred Strategies will deploy QuickLaunch on Azure leveraging the iShift Platform. The partnership between the two companies is determined by several factors: the shared values and uncompromising dedication to client success, the focus on transforming technological innovation into a business advantage, and the firm belief that when it comes specific competencies, it makes sense to find the experts that will complement the gaps in know-how. According to Mark Googins, CEO of iShift, “Our teams are passionate about building long-term trusting partnerships with our clients and delivering the competitive advantage they need to grow their business, improve operational efficiencies, and increase profitability. We are very excited to build our relationship with Preferred Strategies for the long-term by offering organizations innovative cloud-based solutions that will help them turn their data into decision ready information.” According to Adam Crigger, Founder and President of Preferred Strategies, “In today’s ever-changing business climate, organizations need to be able to access their enterprise data anywhere anytime. The cloud environment that the iShift Platform offers provides this flexibility. We are continuing our tradition of pursuing strategic partnerships to deliver modern solutions with enhanced capabilities to clients and empower businesses to realize the full potential of their ERP data.”About Preferred Strategies
In order to be successful and competitive in today’s landscape organizations need to easily access, consume and digest corporate wide data and information. Preferred Strategies is an innovative leader in the decision-making business. Our QuickLaunch solution leads to higher data literacy and corporate wide success because our scalable platform provides customers with a governed decision framework model delivering a single source of truth across all data sources…empowering leaders to make strategic, informed and educated business decisions across the organization. We partner with companies to transform their data into meaningful information displayed in customized dashboards, KPI’s, graphs, charts, key metrics, and reports, with the ability to drill down and through the information to clearly identify insights, trends, and outliers. With hundreds of successful customer partnerships, QuickLaunch has been proven to deliver the perfect balance of user friendly and empowering, innovative functionality, near real time data access, and IT governance without the heavy lifting that competitive organizations require to take their companies to the next level of success. At Preferred Strategies we don’t shy away from what is hard, we come right for it, and we succeed! To learn more about how we can help you accomplish your business goals, visit www.preferredstrategies.comAbout iShift
iShift is a multi-cloud technology solutions company that provides cloud engineering, cloud migration, cloud management and specialized IT staffing services. Our mission is to help businesses to simplify and accelerate growth while enabling digital transformation and IT modernization. No matter where organizations are in their cloud journey, iShift can design, build, optimize and manage a future-ready multi-cloud environment, resulting in significant cost savings, increased workforce productivity, operational resilience, continuity of services, and business agility. For more information on how our offerings empower businesses through their adoption of cloud and modern technology, visit www.ishift.net. [post_title] => iShift and Preferred Strategies Partner to Enable Businesses to Make the Most of Their Enterprise Information in the Cloud [post_excerpt] => iShift and Preferred Strategies have joined forces to deliver a cloud-based implementation of Preferred Strategies’ QuickLaunch. [post_status] => publish [comment_status] => closed [ping_status] => open [post_password] => [post_name] => ishift-preferred-strategies-partners [to_ping] => [pinged] => [post_modified] => 2023-05-22 16:40:16 [post_modified_gmt] => 2023-05-22 23:40:16 [post_content_filtered] => [post_parent] => 0 [guid] => https://preferredstrategies.com/?p=9685 [menu_order] => 0 [post_type] => post [post_mime_type] => [comment_count] => 0 [filter] => raw ) [7] => WP_Post Object ( [ID] => 9658 [post_author] => 6 [post_date] => 2021-11-18 07:00:44 [post_date_gmt] => 2021-11-18 07:00:44 [post_content] => As we move towards the holiday season, let's review what the Power BI team has been up to over the summer and early fall of 2021. There have been some interesting features introduced across all three of our Power BI user categories including automated insights for consumers that leverage the latest in AI and Machine learning, DirectQuery for PBI Datasets and AAS that lets authors customize enterprise data models, and updates to Sensitivity labels which helps Admins better protect assets in Power BI.
Power BI Consumers
Automated Insights Feature (Preview Feature) (Premium Feature)
Leverage the latest automated machine learning feature built into the Power BI consumer experience to easily find and explore insights such as trends, outliers, and KPI analysis with the click of a button inside a report. The Insights feature is context aware so that as you change filters and pages in your report, new insights will be generated. This is an exciting development as reports that were in “Live Connection” previously didn’t not work with many of the latest AI Power BI features. Read more (click to view larger)
Analyze Teams Usages with Power BI Teams App
If you are one of the millions of professionals that has adopted Microsoft’s collaboration app over the past couple of years then this update may interest you. From the Power BI app in Teams, you can easily analyze Teams usage data. The auto generated report includes a My Activity page that shows your personal usage information, a Team activity page allows you to compare general metrics across all the teams you’re a part of, and the Team activity details. Read more (click to view larger)

Power BI Designers
Direct Query for Azure Analysis Services and Power BI Datasets (Preview Feature)
With this feature, power users and report authors create a local model that connects to existing Azure Analysis Services data models and Power BI Datasets and bring in data from other data sources such Excel workbooks and SaaS providers. It also provides the ability for users to personalize or enrich the metadata from existing enterprise semantic models such as changing the formatting of fields and adding new calculated columns. This can be a great tool for prototyping new data model designs or for one off reports that require custom data modeling. Read more (click to view larger)
New Buttons
In the past, if you used buttons in your reports, the formatting options were limited. You were required to use a rectangle shape and customization usually required overlapping visuals. However, with the latest updates to button objects in Power BI, you can now choose between many new shapes, use custom icons, and more. Read more (click to view larger)
Assign Line Chart Series Labels
Sometimes a legend is always enough and to further aid consumers of a report, it is helpful to be able to assign labels to elements in your visualizations. With this new enhancement, you are now able to provide more clarity on which lines are associated with categories using the new series labels formation option. (click to view larger)
Turn Off Total Column in Waterfalls Charts
Waterfall charts are great visualization to have in your toolbelt and with this update, you can now customize the visualization further by being able to control whether a total column is displayed or not. By default, this will be enabled to show what the total was across all the elements in the series, however you can turn if off under the formatting pane for the visual. (click to view larger)

Power BI Admins & Content Managers
Bulk Upgrade Classic Workspaces to V2 Workspaces
The Power BI team has created a bulk-upgrade tool within the Workspaces section of the Power BI Service Admin portal that allows admins to automatically update all the classic workspaces in their tenant to the latest V2 version. The new workspace is required to get the latest features and security enhancements in Power BI. Read more (click to view larger)
Microsoft Information Protection (MIP) and Sensitivity Labels
MIP helps organizations classify and protect information as it moves inside and outside of the organization and across devices, apps, and services to prevent data loss. One of the main MIP tools to accomplish this is creating sensitivity labels and label policies that can be inherited across different data sources and file types. Once you create different sensitivity categories, you can enforce protection settings based on that classification such as encryption and content markings. In Power BI, you can assign Sensitivity labels to corporate data sources such as Azure SQL DB, Power BI Datasets and reports, and files such as Excel workbooks. Read more (click to view larger)
Power BI Desktop Required Infrastructure Change
Microsoft is changing the components used by the Power BI Desktop application. Starting in Feb 2022, Power BI Desktop will move away from CerSharp to WebView2. To avoid interruptions, ensure that users that use PBI Desktop have ‘Microsoft Edge WebView2 Runtime’ installed on your machines. Read more We are excited about what the Power BI team is releasing soon! If you're interested in checking out the Power BI feature release plan in an interactive Power BI report click here. [post_title] => Power BI Updates for QuickLaunch Customers: Q3 2021 [post_excerpt] => As we move towards the holiday season, let's review what the Power BI team has been up to over the summer and early fall of 2021. [post_status] => publish [comment_status] => closed [ping_status] => open [post_password] => [post_name] => power-bi-updates-q3-2021 [to_ping] => [pinged] => [post_modified] => 2023-05-22 16:40:16 [post_modified_gmt] => 2023-05-22 23:40:16 [post_content_filtered] => [post_parent] => 0 [guid] => https://preferredstrategies.com/?p=9658 [menu_order] => 0 [post_type] => post [post_mime_type] => [comment_count] => 0 [filter] => raw ) [8] => WP_Post Object ( [ID] => 9603 [post_author] => 4 [post_date] => 2021-09-23 17:36:23 [post_date_gmt] => 2021-09-23 17:36:23 [post_content] => Mark Twain is quoted, “Everybody talks about the weather, but no one ever does anything about it.” A similar sentiment might be said about junk data. It is a blight which perpetually limits our ability to make data driven decisions which will improve our businesses. Being informed by quality data is more imperative in business than ever to remain competitive and profitable. If your data is ‘junk’, you can never become a data driven organization. Sometimes junk data accumulates because organizations lack disciplined business processes. Additionally, they may not have the analytics framework in place to monitor those processes and ensure they are followed. Most dimensional or categorical data is generated manually by human input or by automated systems. When these fail, data is assigned inconsistent values and reporting on inconsistent junk data is nearly impossible. Another cause of junk data is the lack of a planned governed decision framework. Many companies’ analytics efforts are focused on one specific ‘use case’ at a time. Each project becomes a silo built for a specific user or purpose. These independent repositories of data are not built using a common standard which leads to data structures varying widely from one solution to the next. Alternatively, a governed decision framework will eliminate siloed solutions and have these characteristics:1. User friendly
You shouldn’t need to be a data scientist to be able to use and understand the data.2. Formatting
Dates, numbers, percentages, and dimensional values should be formatted the same throughout the data set. If you use ‘96.5%’ in one column, another percentage column in the same data set should not read ‘.965’.3. Trustworthy
Aggregations of data should be able to be validated against the detail transactions so that end users know they can trust the information and insights obtained.4. Completeness
If you have dimensional data such as a ‘region’ code, every row of data should always have a value. If the value doesn’t apply, show something like ‘N/A’ instead of leaving it blank. Blank values don’t tell the end user if the field was accidently or purposefully left out. Preferred Strategies is often told by prospective clients that they want to ‘clean up’ their data before they start an analytics initiative. Our experience has been that until the prospective client embarks on an analytics initiative (and experiences the frustration of junk data), they will never have the process discipline required to enforce the creation of reliable, trustworthy data. If your company is ready build a governed decision framework which will help to clean up your data and provide a solid foundation for analytics excellence, contact us to see how we can help. That is, don’t just talk about the weather, do something about it. [post_title] => Are You Ready to Tackle Your Junk Data? [post_excerpt] => If your data is ‘junk’, you can never become a data driven organization. [post_status] => publish [comment_status] => closed [ping_status] => open [post_password] => [post_name] => junk-data [to_ping] => [pinged] => [post_modified] => 2023-05-22 16:40:17 [post_modified_gmt] => 2023-05-22 23:40:17 [post_content_filtered] => [post_parent] => 0 [guid] => https://preferredstrategies.com/?p=9603 [menu_order] => 0 [post_type] => post [post_mime_type] => [comment_count] => 0 [filter] => raw ) ) [post_count] => 9 [current_post] => -1 [before_loop] => 1 [in_the_loop] => [post] => WP_Post Object ( [ID] => 10141 [post_author] => 2 [post_date] => 2022-06-29 18:27:14 [post_date_gmt] => 2022-06-29 18:27:14 [post_content] => [post_title] => Learn How Power BI Resolves Daily Production Challenges [post_excerpt] => In this Education Session, you will learn how to dig deep into your JD Edwards data and gain a clear understanding of how to stay ahead of your quickly shifting and impactful business environment. [post_status] => publish [comment_status] => closed [ping_status] => closed [post_password] => [post_name] => learn-how-power-bi-resolves-daily-production-challenges [to_ping] => [pinged] => [post_modified] => 2022-10-11 10:01:48 [post_modified_gmt] => 2022-10-11 17:01:48 [post_content_filtered] => [post_parent] => 0 [guid] => https://preferredstrategies.com/resource/transform-it-into-a-strategic-business-advantage-using-your-viewpoint-vista-data-copy/ [menu_order] => 0 [post_type] => resource [post_mime_type] => [comment_count] => 0 [filter] => raw ) [comment_count] => 0 [current_comment] => -1 [found_posts] => 112 [max_num_pages] => 13 [max_num_comment_pages] => 0 [is_single] => [is_preview] => [is_page] => [is_archive] => [is_date] => [is_year] => [is_month] => [is_day] => [is_time] => [is_author] => [is_category] => [is_tag] => [is_tax] => [is_search] => [is_feed] => [is_comment_feed] => [is_trackback] => [is_home] => 1 [is_privacy_policy] => [is_404] => [is_embed] => [is_paged] => 1 [is_admin] => [is_attachment] => [is_singular] => [is_robots] => [is_favicon] => [is_posts_page] => [is_post_type_archive] => [query_vars_hash:WP_Query:private] => 853252536aa8398b1dfcf7efa4927ca7 [query_vars_changed:WP_Query:private] => [thumbnails_cached] => [allow_query_attachment_by_filename:protected] => [stopwords:WP_Query:private] => [compat_fields:WP_Query:private] => Array ( [0] => query_vars_hash [1] => query_vars_changed ) [compat_methods:WP_Query:private] => Array ( [0] => init_query_flags [1] => parse_tax_query ) )
In this Education Session, you will learn how to dig deep into your JD Edwards data and gain a clear understanding of how to stay ahead of your quickly shifting and impactful business environment.
In this educational session you will experience how simple it is to turn your Viewpoint Vista investment into one of your most valuable business assets.
In this educational session you will experience how simple it is to turn your JDE investment into one of your most valuable business assets.

Finance teams often report a lack of confidence in their month-end close. This stressful, time-consuming, error-prone process leads finance teams to spend 80% of their time wrestling with data to reach a deadline and little to no time analyzing the data to deliver true business value.
Learn how QuickLaunch Information Engine can transform your JDE data for month-end close and give you the opportunity to spend more time analyzing the numbers… less time preparing them.

Silicon Valley-based software reporting, analytics, and business intelligence company expands and enhances its QuickLaunch product line to meet increasing marketplace demand.
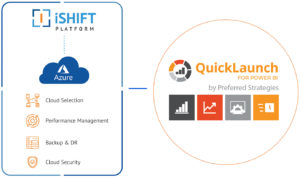
iShift and Preferred Strategies have joined forces to deliver a cloud-based implementation of Preferred Strategies’ QuickLaunch.

As we move towards the holiday season, let’s review what the Power BI team has been up to over the summer and early fall of 2021.
If your data is ‘junk’, you can never become a data driven organization.