Category: Power BI
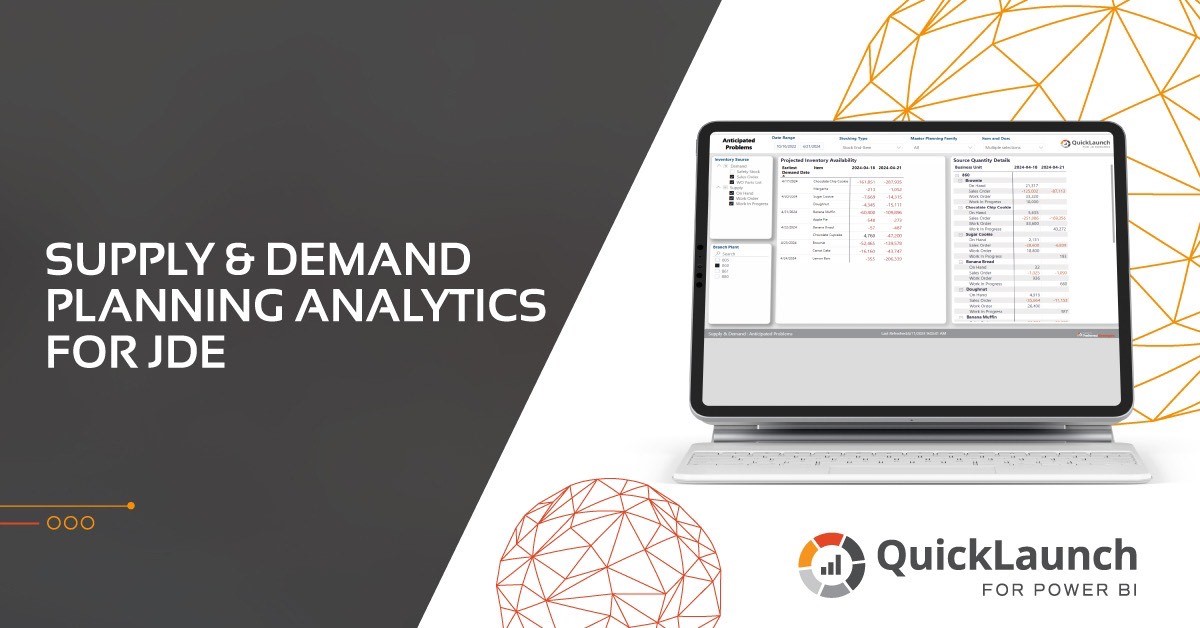
Maximize Efficiency with Supply and Demand Planning Analytics for JD Edwards
Today, according to Allied Market Research on Supply Chain Management, only 6% of companies claim to have full visibility into their supply chain. Furthermore, their 2023 report claims that organizations can double profits by reducing supply chain costs. This indicates that most companies can stand to make a lot more money if they are able to increase transparency through better access to supply chain information and more efficient processes. At Preferred Strategies, we’ve been helping manufacturing companies that run JD Edwards gain visibility into their supply chain processes since 2002 with our QuickLaunch for JDE solution. The latest QuickLaunch product
Power BI Updates for Enterprise Analytics: Q2 2023 – Part 1
As we move towards the holiday season, let’s review what the Power BI team has been up to over the summer and early fall of 2023.
ERP Data: Are You Using It or Just Collecting It?
Many companies never touch the majority of the data they collect because it’s locked up deep in their Enterprise Resource Planning Data (ERP). ERP is software your organization can use to manage its day-to-day business activities. These activities include accounting, project management, compliance, procurement, risk management, and supply chain operations. Your ERP can track activities that naturally occur in your business. This software can coordinate the flow between all these activities with the data it collects, often in real-time. Most companies’ ERP collects information that can increase productivity, cut costs, and identify bottlenecks, and they are not utilizing it. Join
The Acceleration Gap: Is Your Organization Adapting to Change
How would you like to decrease the amount of money your organization spends? Or what about increasing productivity while having happy employees at the same time? It’s all possible if your organization is structured in a way that allows it to adapt to change. These days, most employees are experiencing burnout. Meanwhile, the power of technology to allow a business to grow is increasing every day. Unfortunately, this is causing an acceleration gap, meaning the difference between the pace of technology and the ability of companies to keep up is getting farther and farther apart. This is why it is
Organizational Decision-Making: Untangling Your Data with Power BI
Effective organizational decision-making is reacting to what’s currently happening in your business utilizing data analytics. For clarity, data analytics refers to modifying raw data into a usable format. But, as any business leader can attest, having easily accessible, insightful data from disparate sources often seems like a pipe dream. James Bradshaw of Ernst & Young states, “To be truly successful, organizational leadership must agree that data is an asset worth investing in. From the boardroom to the C-suite, this focus on data and analytics driving decision making is crucial.” So, how do you untangle your data into the meaningful information
Power BI Updates for QuickLaunch Customers: Q3 2021
As we move towards the holiday season, let’s review what the Power BI team has been up to over the summer and early fall of 2021.
Power BI Updates for QuickLaunch Customers: Q2 2021
The Power BI team has been releasing new features in full force. Q2 has seen a steady stream of updates to all areas of the platform.
Power BI Updates for QuickLaunch Customers: 2020 in Review – Part 2 – Designers
Designing reports and dashboards in Power BI is exciting because things are constantly being upgraded to make your life easier and more interesting. The Power BI team releases updates for Power BI Desktop on a monthly cadence. In the second part of our 2020 in Review series, we will review some of our favorite updates for Power BI users that are responsible for creating reports and dashboards.
Power BI Updates for QuickLaunch Customers: 2020 in Review – Part 1 – Consumers
The Power BI team constantly rolls out new features and enhancements to the Power BI platform including updates to the Power BI Desktop, the Power BI Service, and the Power BI Mobile App. While it is awesome that Microsoft is committed to this continuous delivery strategy to quickly push updates into production, sometimes it can feel like drinking out of a firehose when trying to keep up with all the latest news.


