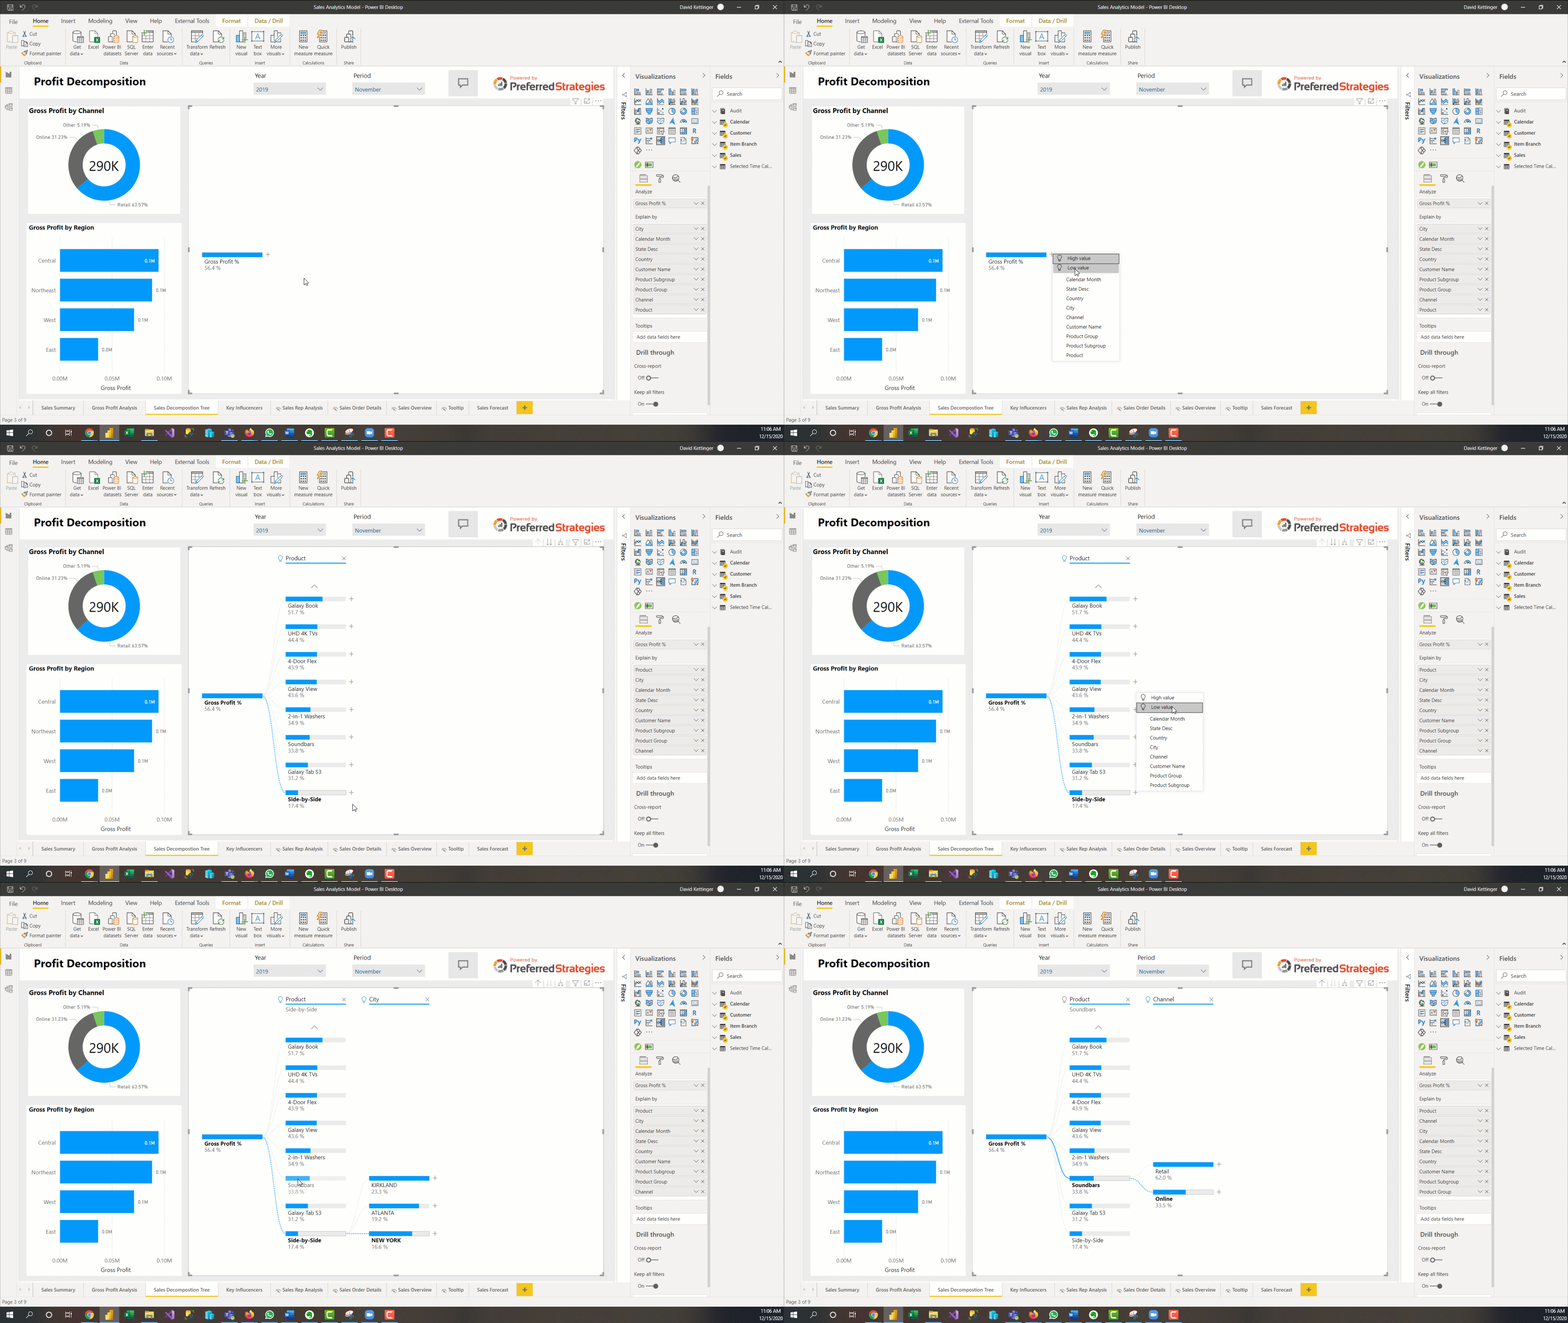
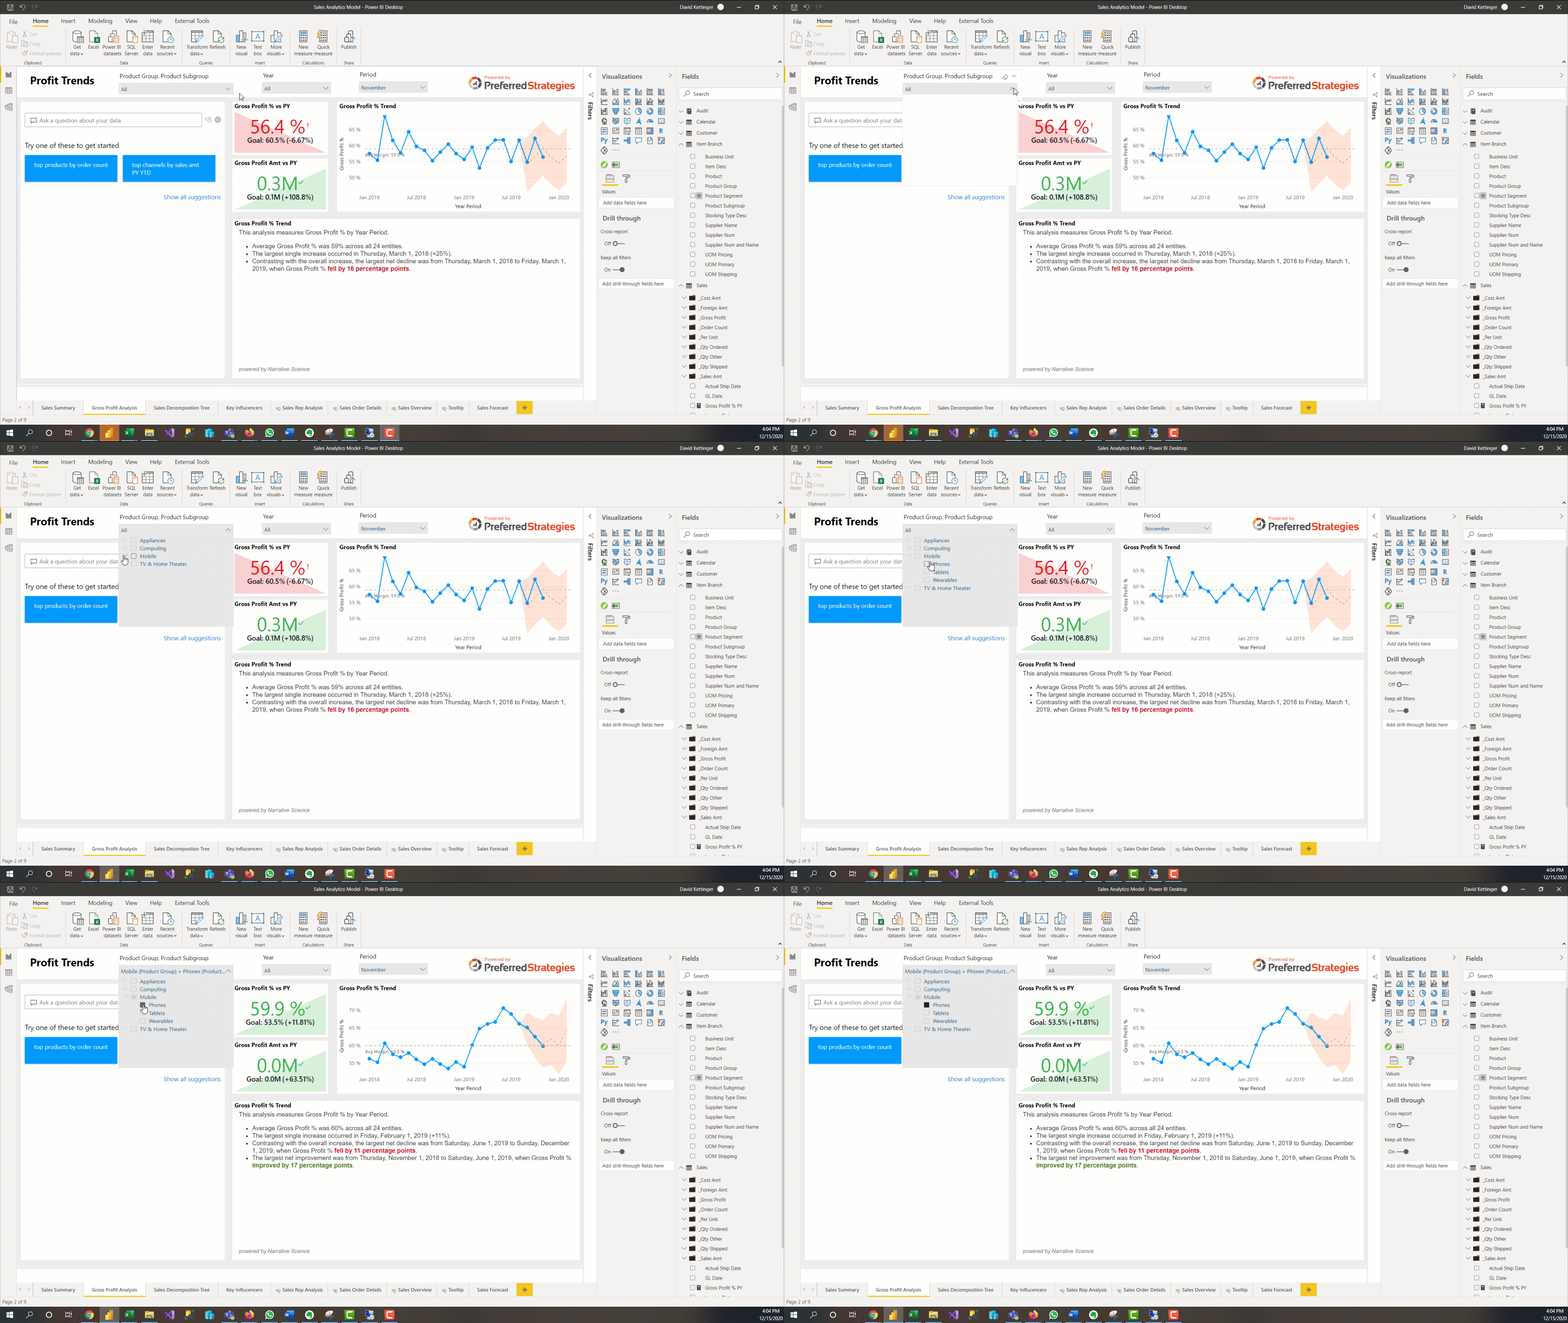
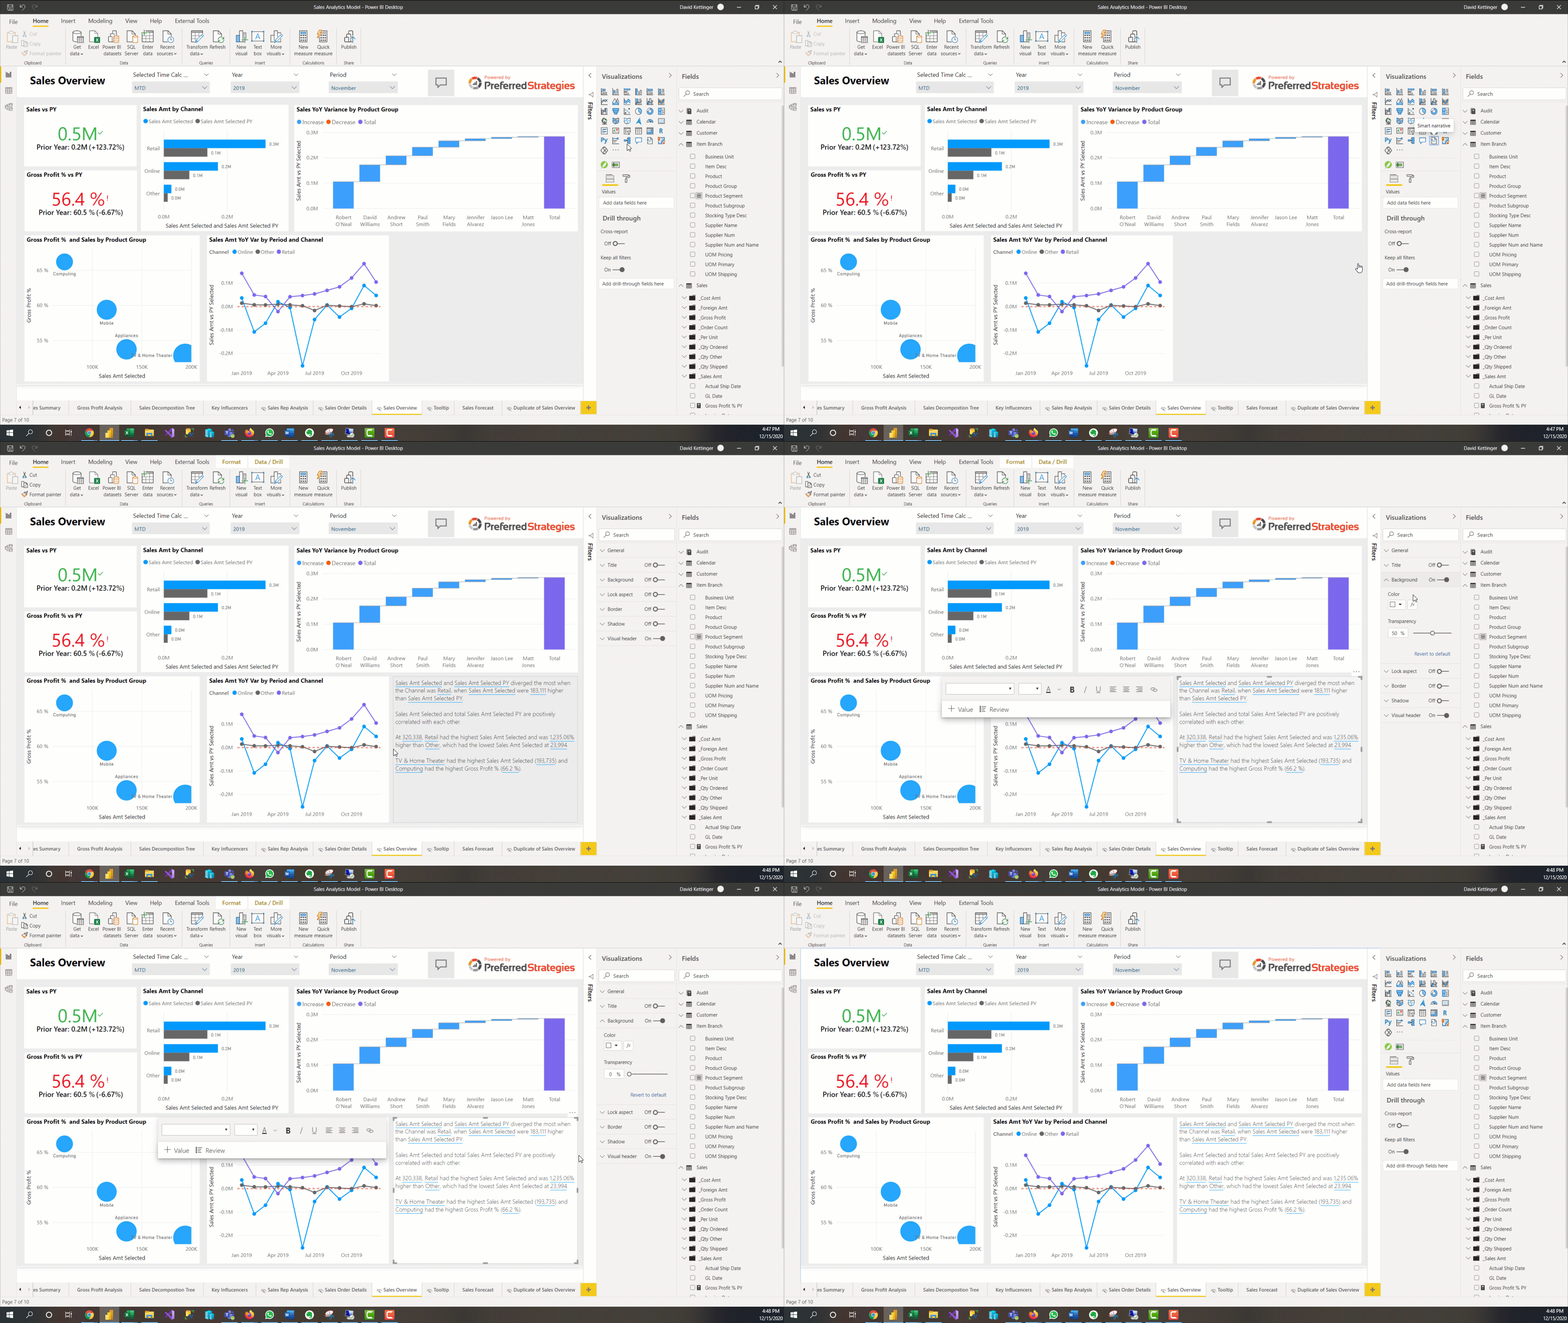
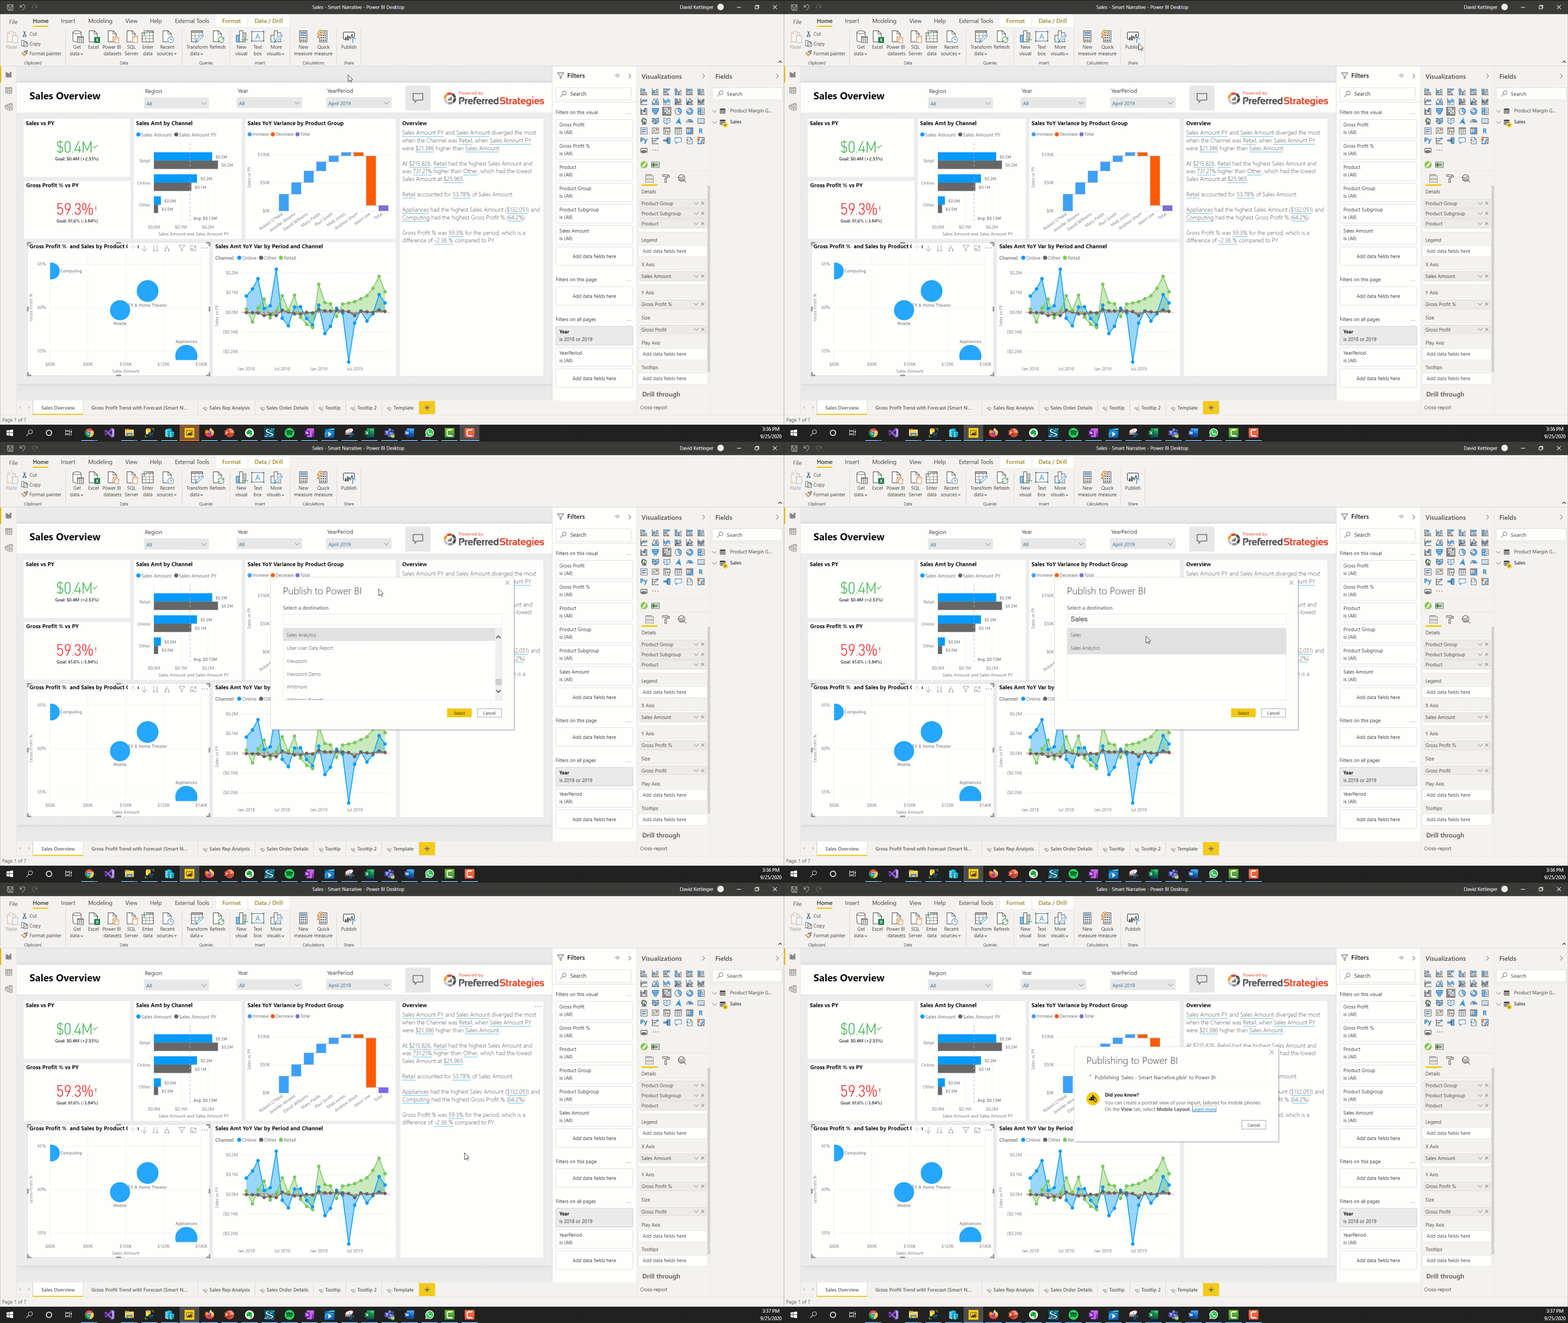
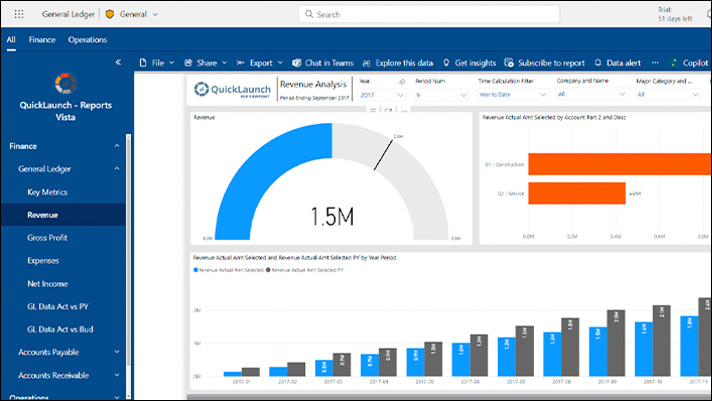
- Power BI Consumers – Users that mainly interact with Power BI to consume insights
- Power BI Designers – People who are actively developing reports, dashboards, and data models
- Power BI Admins and Content Managers – Users who administer Power BI settings and maintain content in the Power BI Service
Power BI Consumers
Power BI App in Teams (Preview)
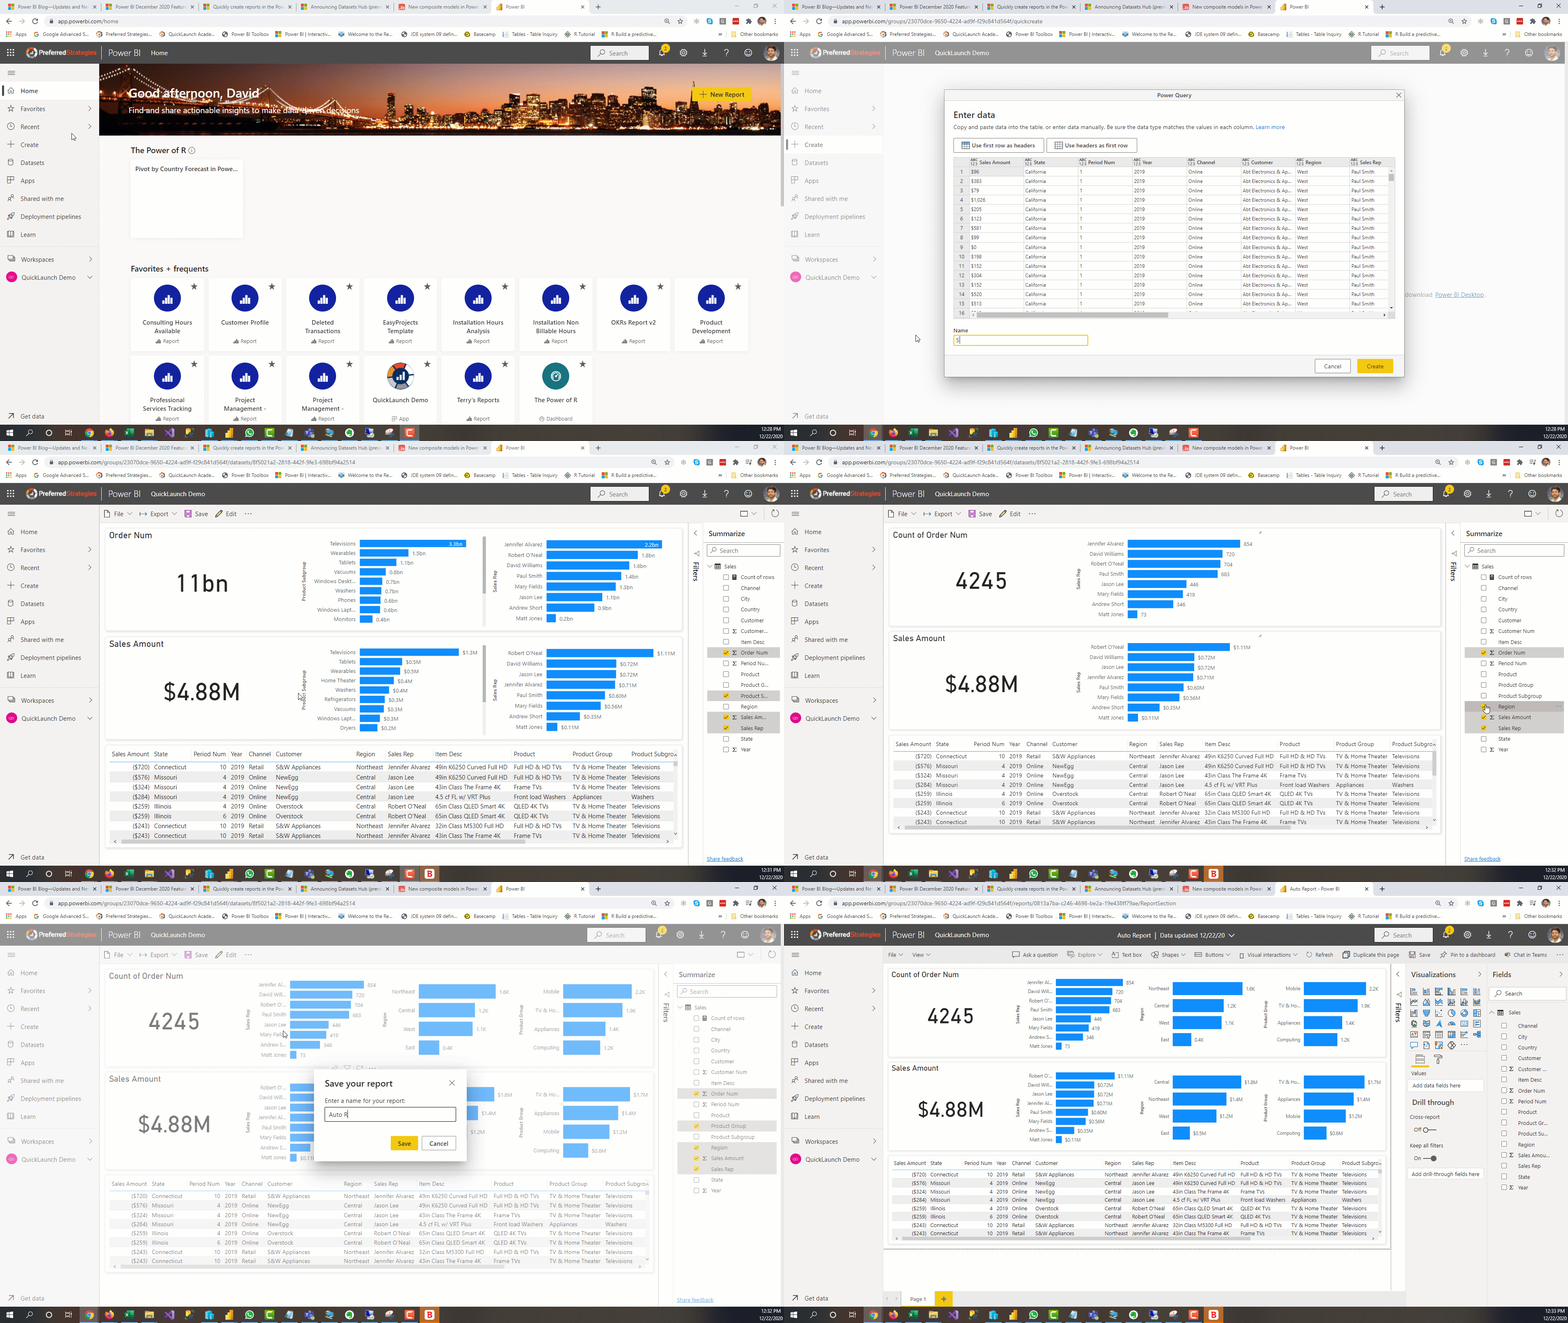
With the new Power BI App in teams, consumers can view and discuss PBI content from the same place. This new integration essentially allows users to have the full Power BI experience within Teams so they no longer need to use a browser to reach the PBI service. Microsoft has been pretty good at integrating Power BI with other O365 applications such as Excel and PowerPoint so it is exciting to see them incorporate PBI into Teams so that data can be closer to the dialogue and decision making within organizations. Read More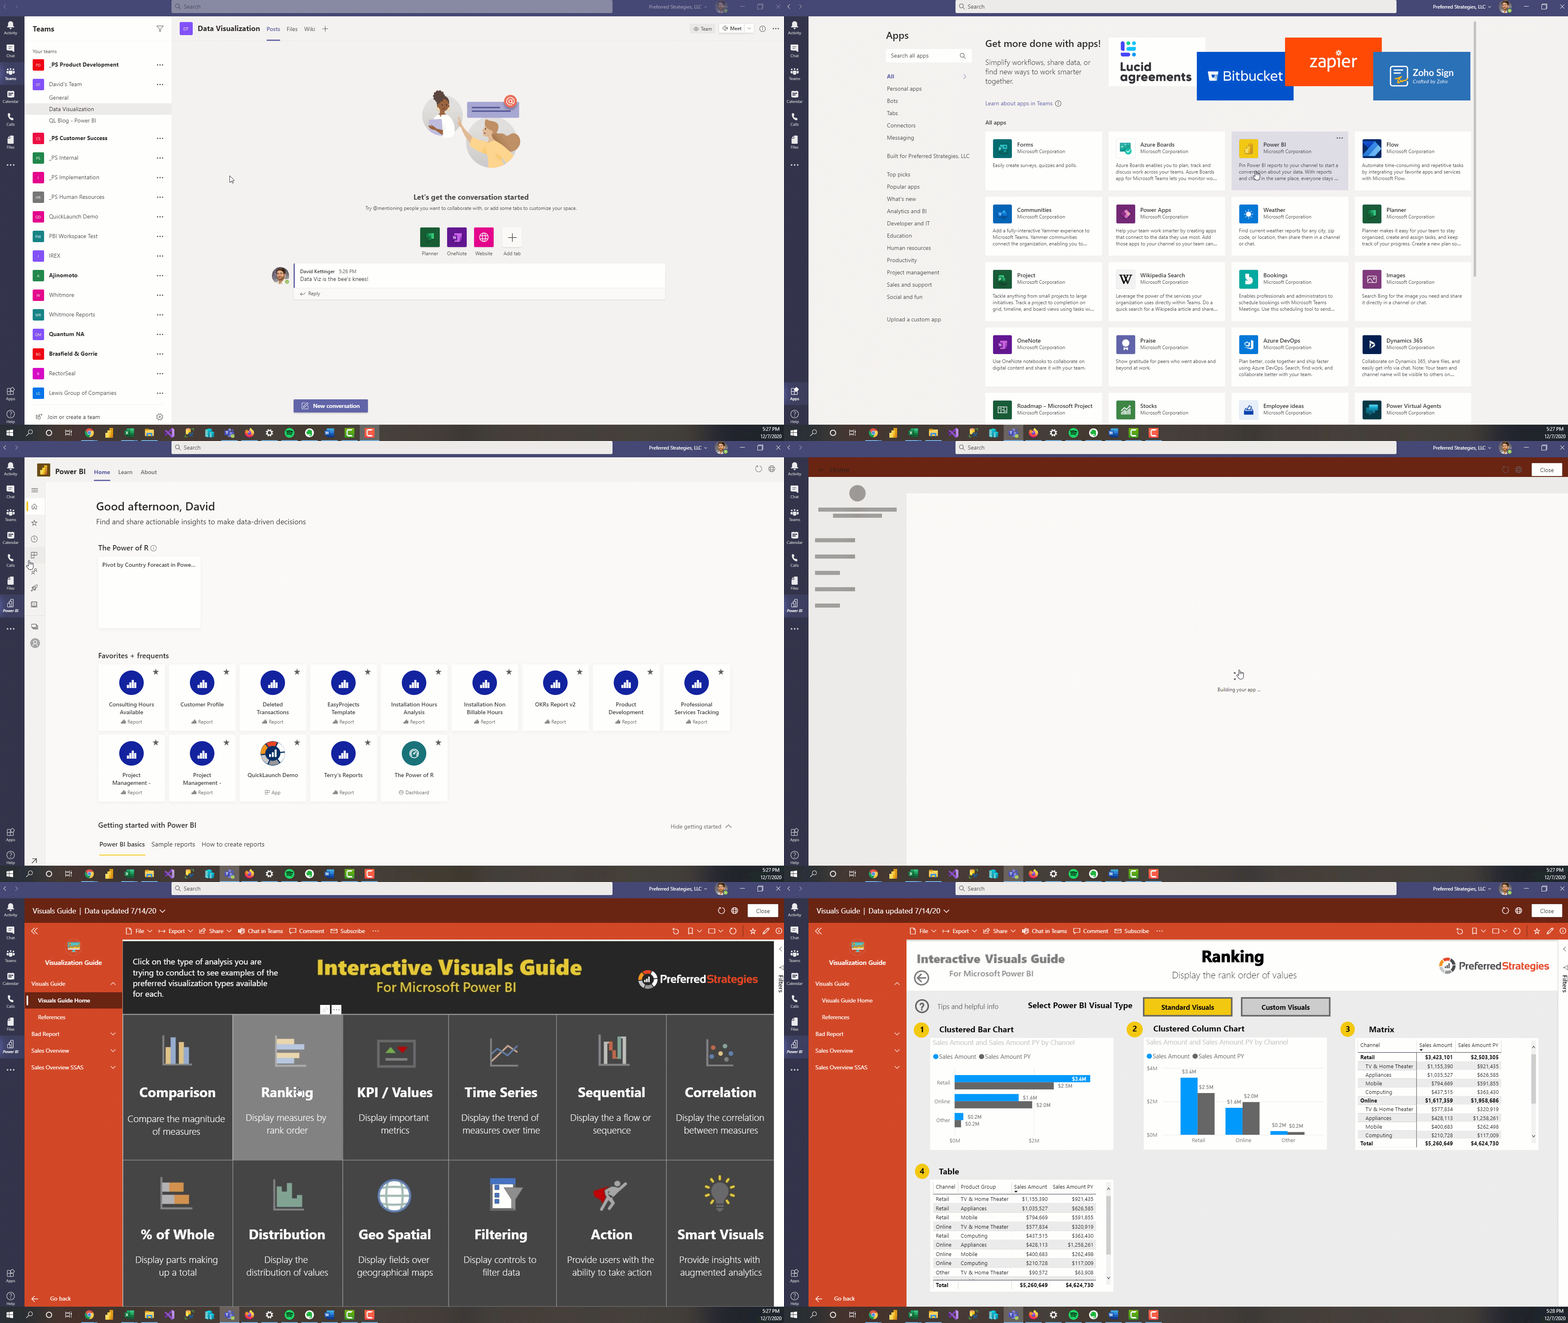
New User Interface for PBI Service
Power BI updated the UI for the PBI Service, making it cleaner and more user friendly. These updates have been in Preview for over a year but are now generally available as of November 2020. While in preview, users had to use the New Look On/Off toggle switch in the top ribbon of the PBI Service to control what UI they were shown but now the new look is automatically enabled for everyone. Learn MorePersonalize Visuals
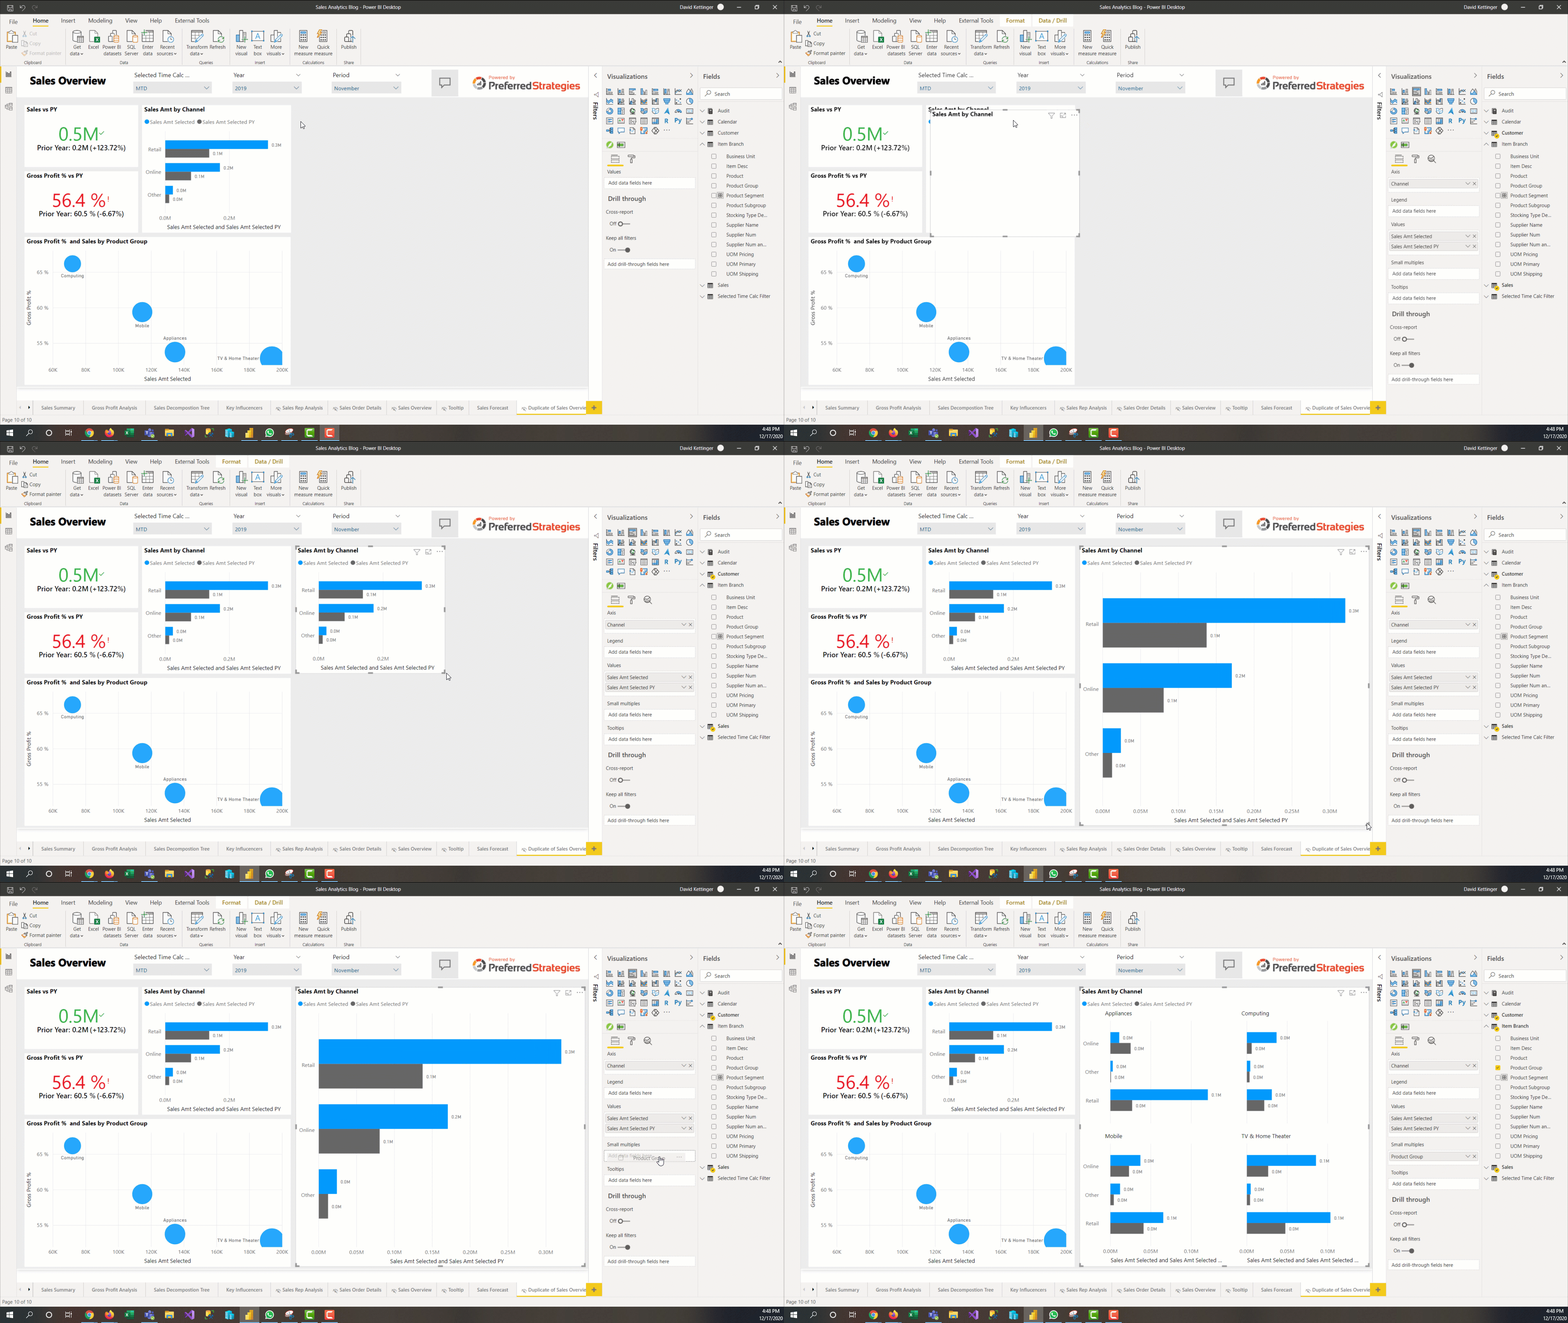
It is hard to make one version of a report that will satisfy every user in an organization. The Personalize Visuals feature allows consumers to make changes to the visualizations in a report while in reading view. This includes changing the visualization type, adding a legend, and changing the fields used within the visual. After making these updates, users can save them as a Personalized Bookmark so they can come back to them later without having to modify the existing report. Learn More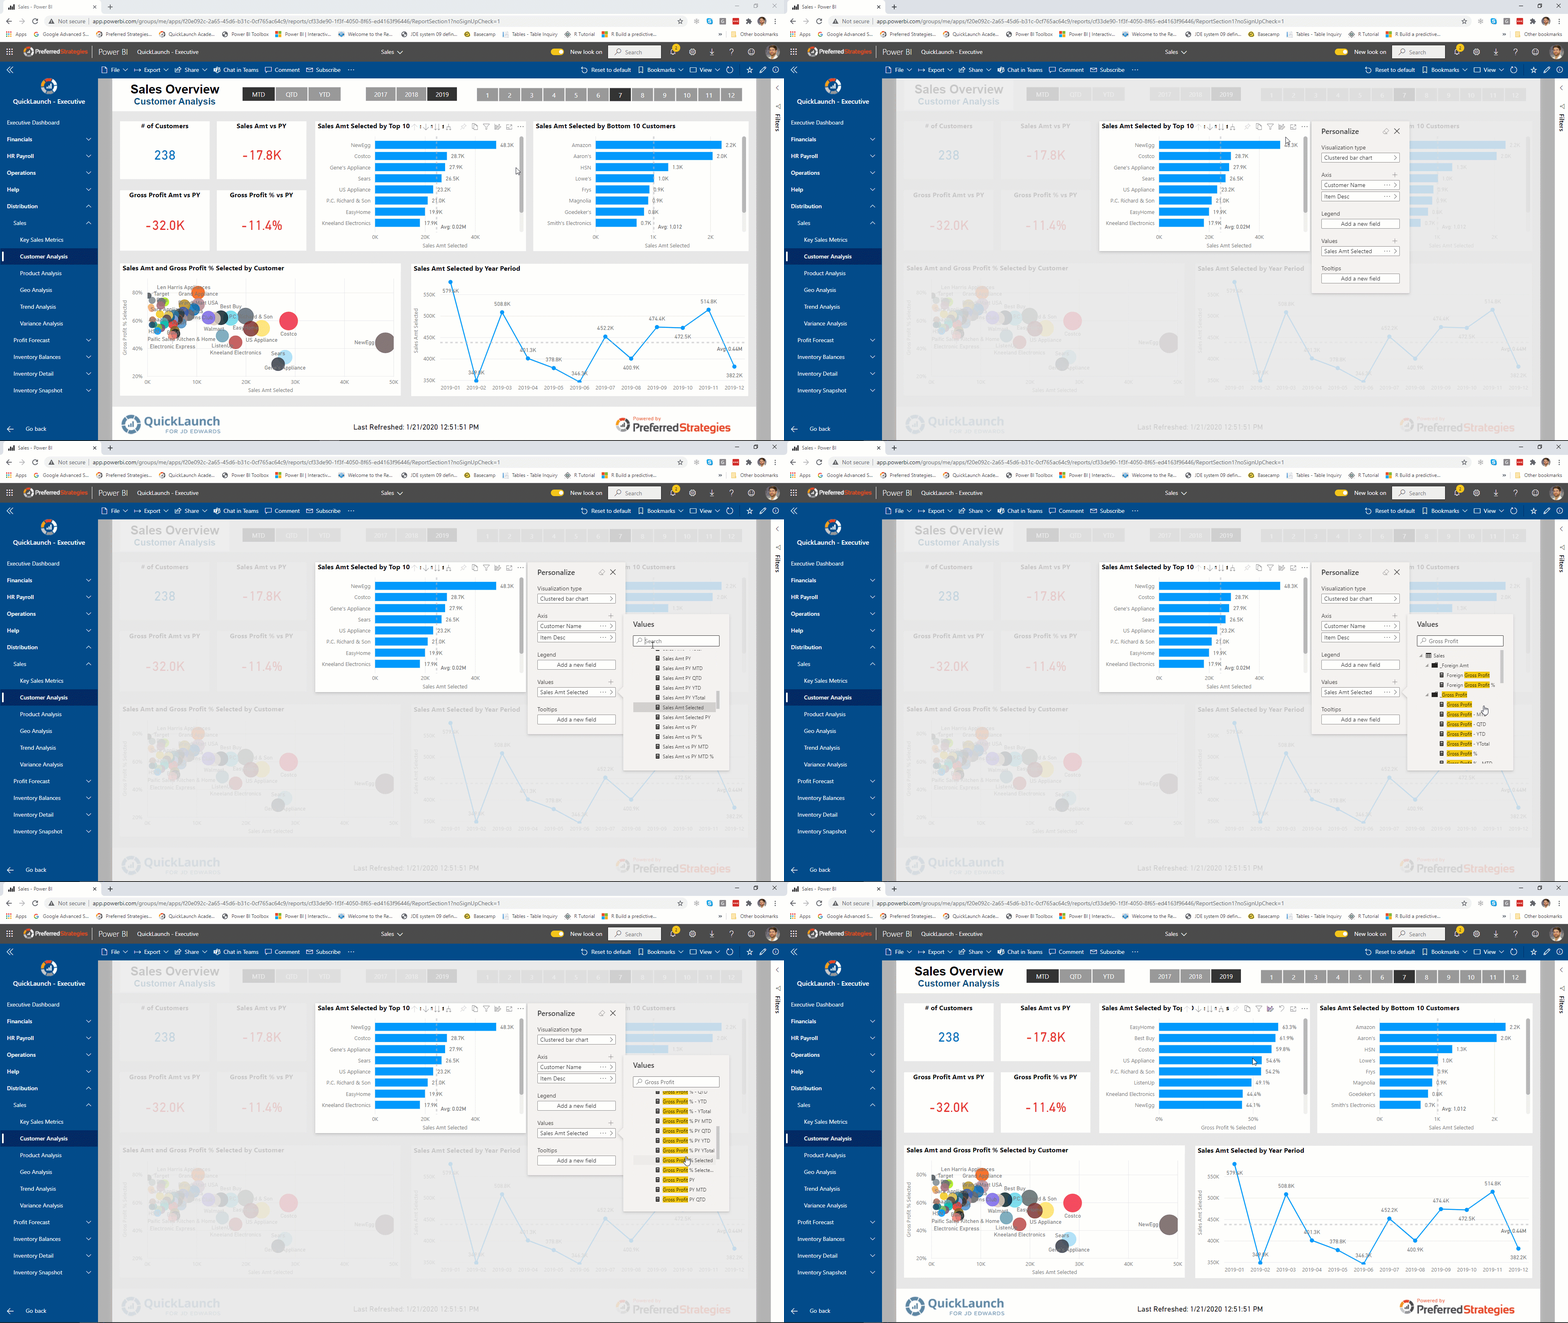
Apply All Filters
By default in Power BI, when you change a filter value in the filter pane it simultaneously applies the updates to the report. In Live Connection mode to Analysis Services Tabular models and Power BI Datasets, this means that every time you change a slicer or filter, the report will send out new queries to the database and the visuals on the report will have to render again. In order to reduce the number or queries sent to the database and potentially the load time for consumers, there is a new feature that allows you to update all your filter values and then apply the changes all at the same time. This Apply All Filters features needs to be enabled in the report settings so ask your report designer to enable this functionality if you are interested in this. Learn More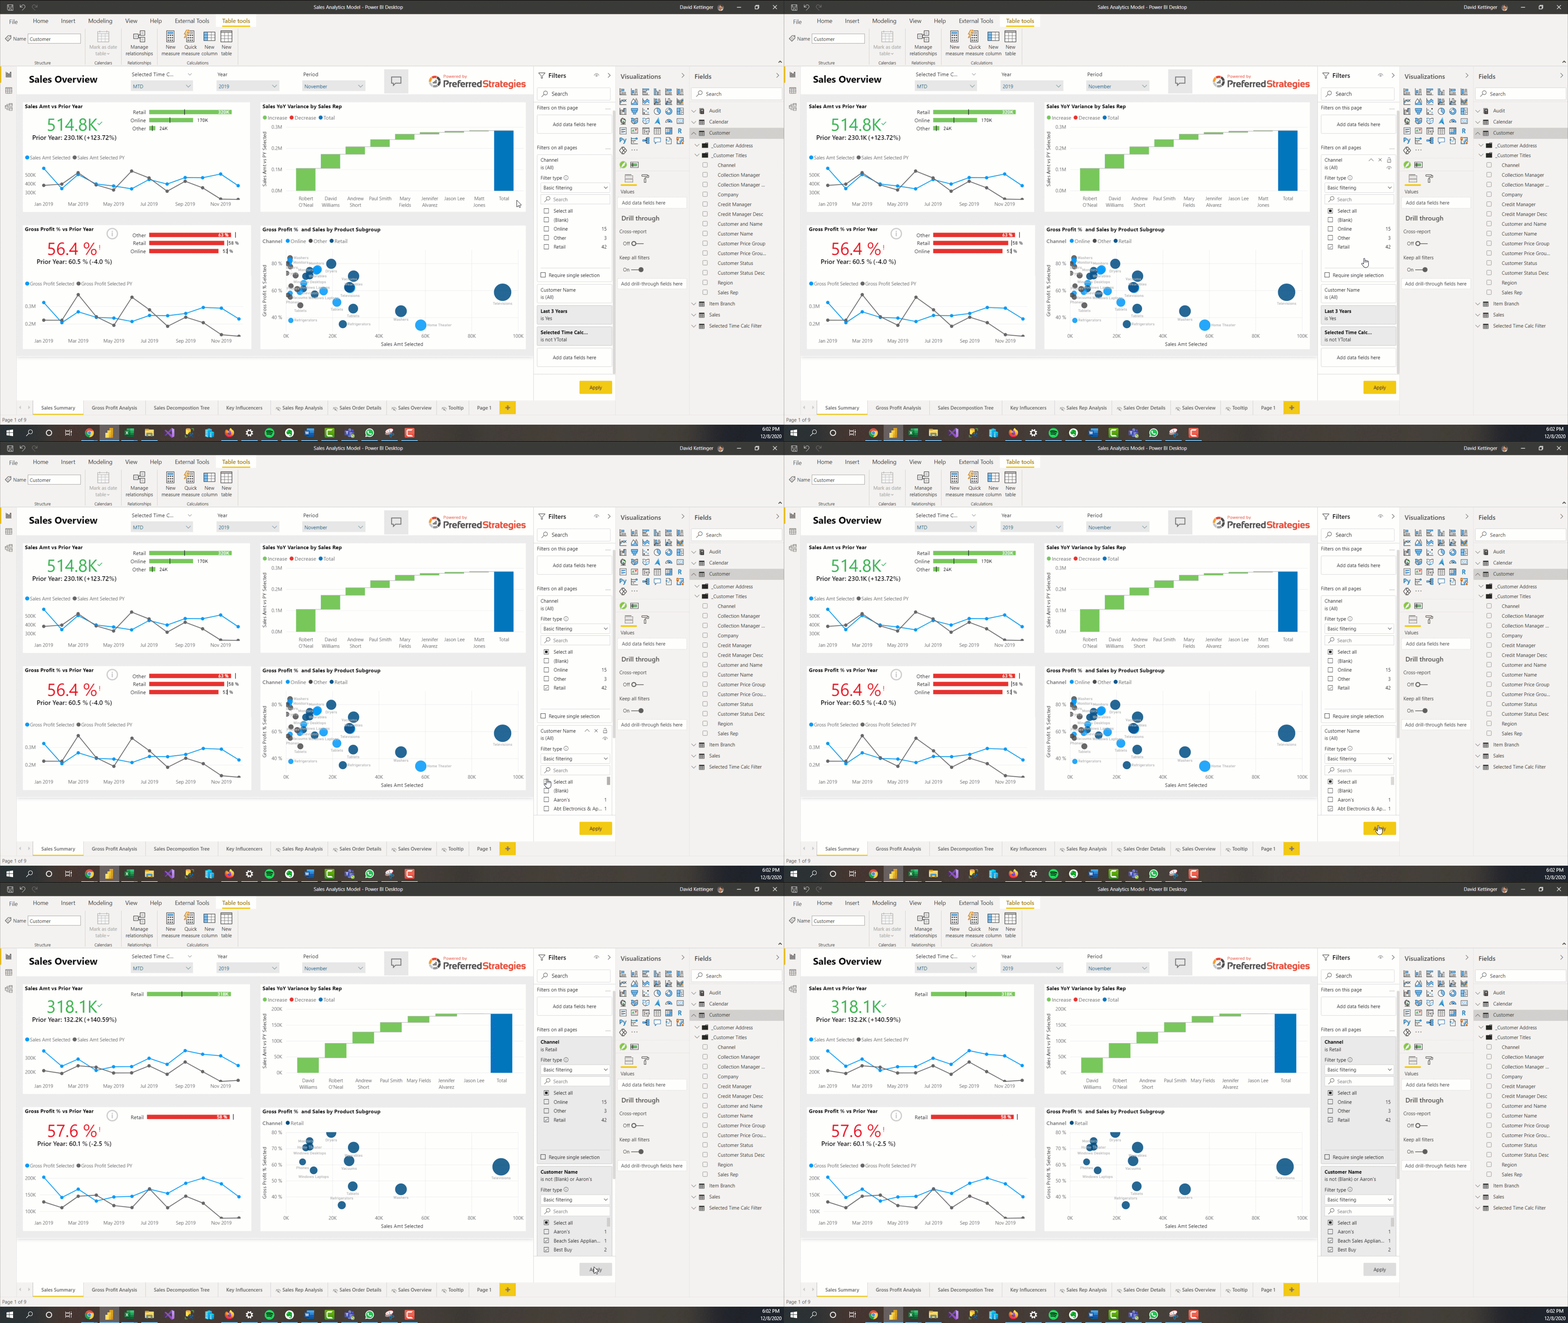
Rectangle Select (Preview)
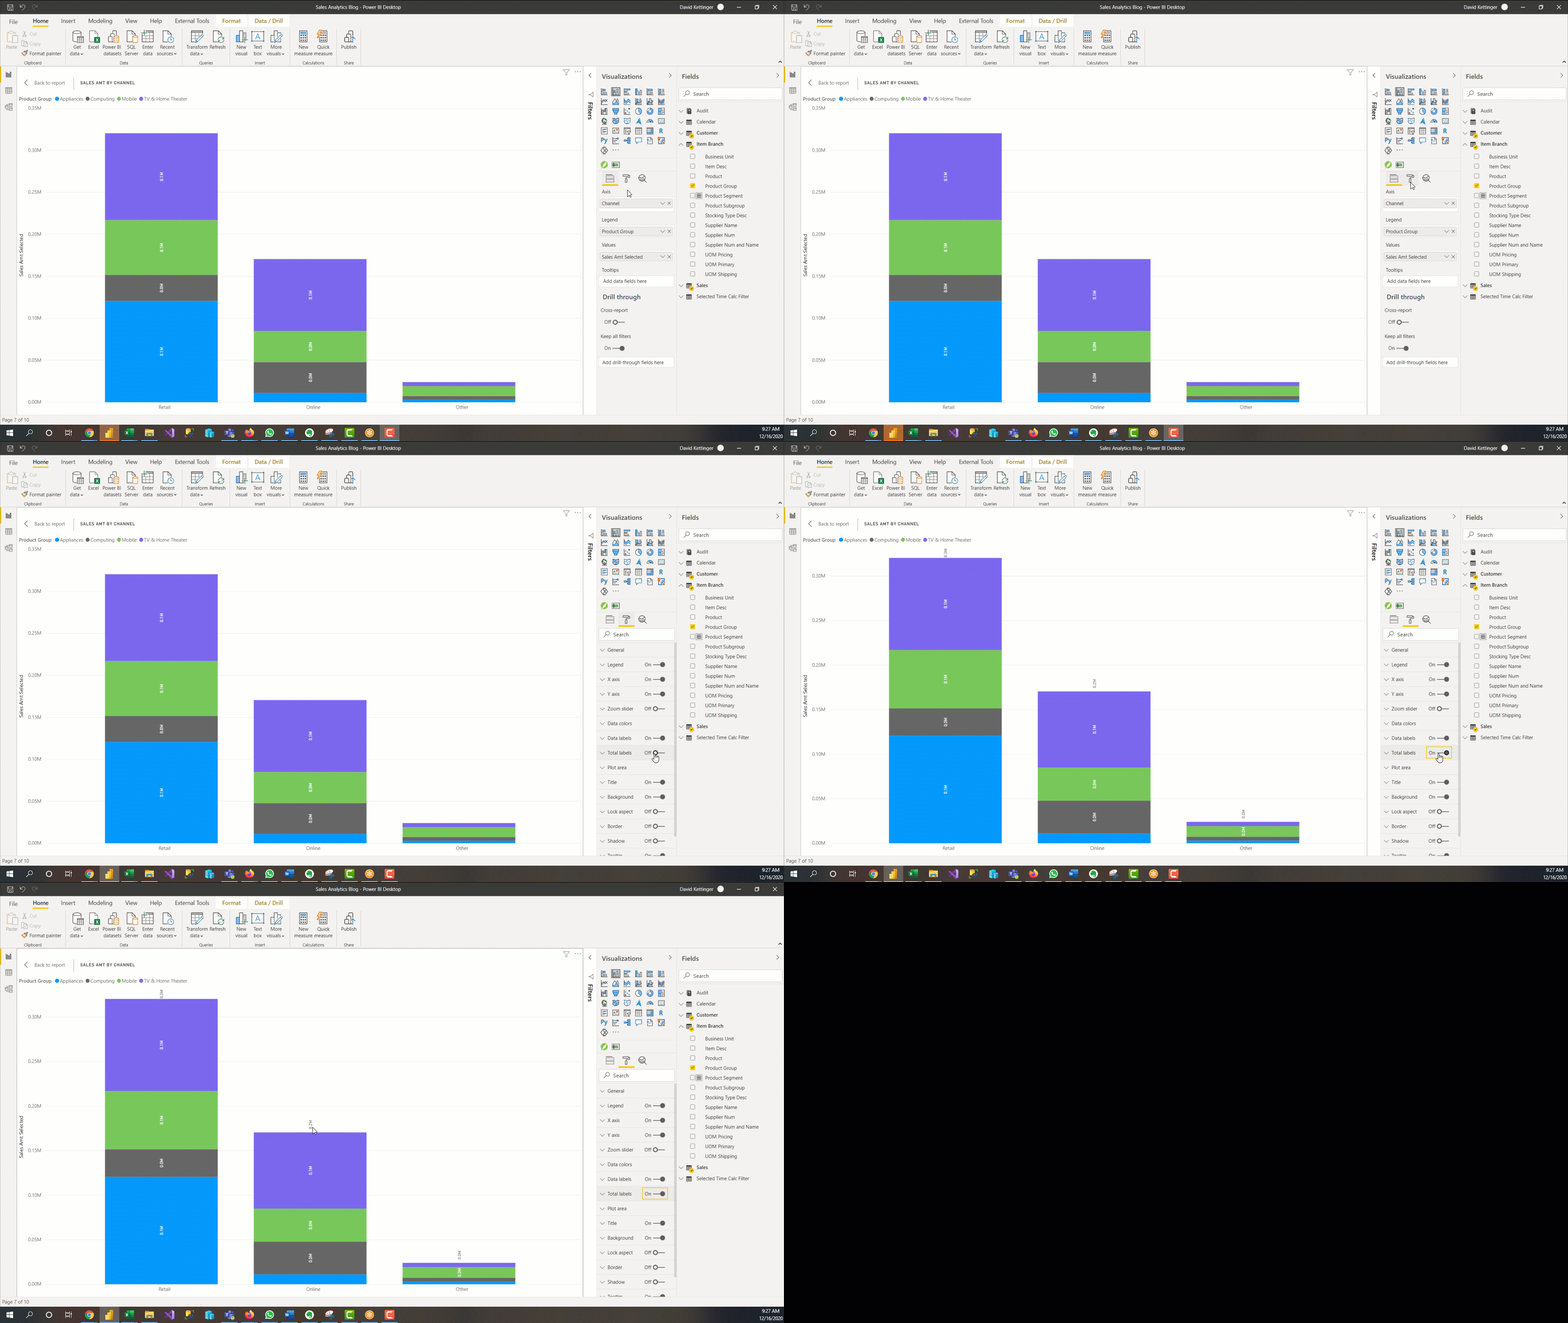
Otherwise known as Lasso select in other applications, this functionality allows you to select multiple data points simultaneously by drawing a rectangle around the data points. It is supported for map, line, area, combo, stacked bar/column, clustered bar/column, 100% stacked bar/column, and clustered line and column charts. Use it to quickly analyze segments or clusters within your data.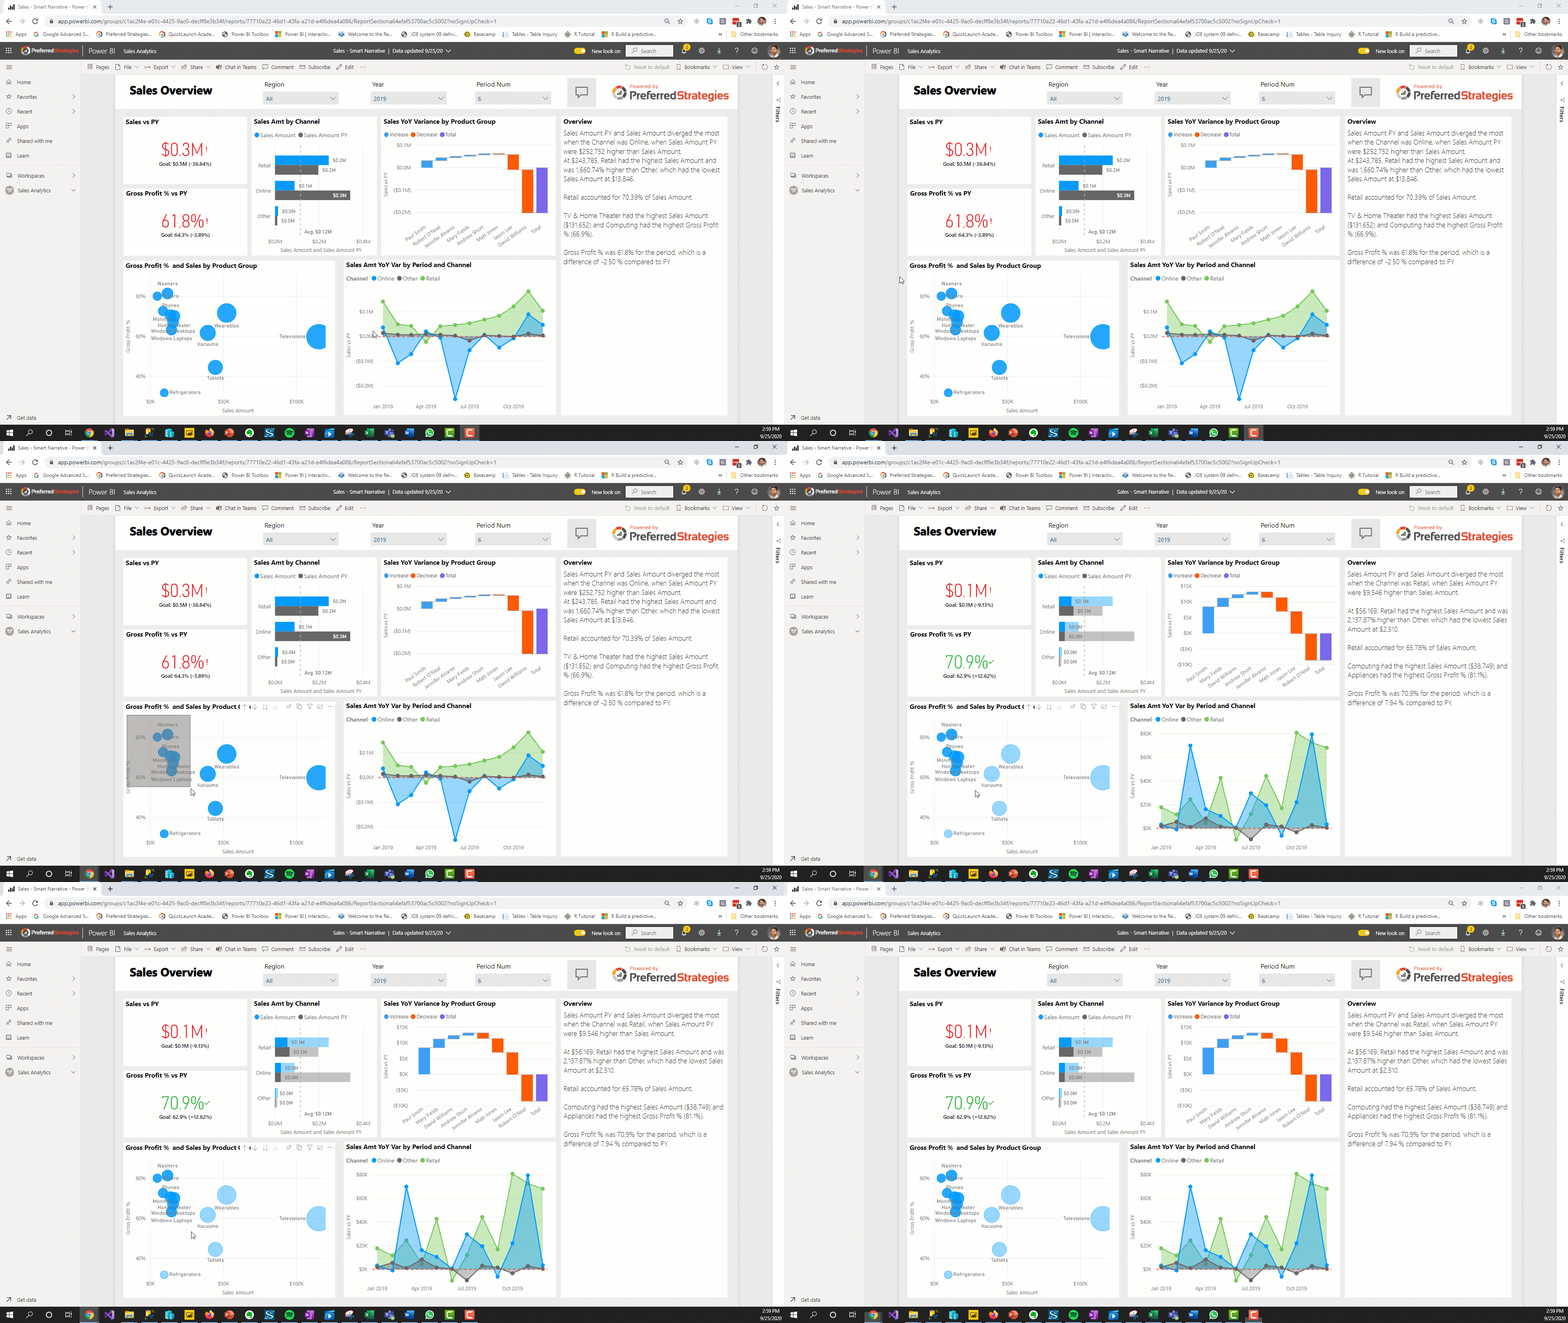 Stay tuned for Part 2 of this blog installment which will cover updates for users that are designing Power BI reports.
[post_title] => Power BI Updates for QuickLaunch Customers: 2020 in Review - Part 1 - Consumers
[post_excerpt] => The Power BI team constantly rolls out new features and enhancements to the Power BI platform including updates to the Power BI Desktop, the Power BI Service, and the Power BI Mobile App. While it is awesome that Microsoft is committed to this continuous delivery strategy to quickly push updates into production, sometimes it can feel like drinking out of a firehose when trying to keep up with all the latest news.
[post_status] => publish
[comment_status] => closed
[ping_status] => open
[post_password] =>
[post_name] => power-bi-updates-quicklaunch-2020-part1
[to_ping] =>
[pinged] =>
[post_modified] => 2023-05-22 16:40:21
[post_modified_gmt] => 2023-05-22 23:40:21
[post_content_filtered] =>
[post_parent] => 0
[guid] => https://preferredstrategies.com/?p=6870
[menu_order] => 6
[post_type] => post
[post_mime_type] =>
[comment_count] => 0
[filter] => raw
)
[3] => WP_Post Object
(
[ID] => 6816
[post_author] => 2
[post_date] => 2020-11-06 08:10:34
[post_date_gmt] => 2020-11-06 16:10:34
[post_content] =>
[post_title] => The Future of ERP Analytics with Machine Learning
[post_excerpt] => In this demo-filled glimpse into the future of analytics, we illustrate some of the unbiased insights that can be gained from a common JDE infrastructure with AI-enabled advanced analytics, natural-language query and generation, and smart data visualization.
[post_status] => publish
[comment_status] => closed
[ping_status] => closed
[post_password] =>
[post_name] => the-future-of-erp-analytics-with-machine-learning
[to_ping] =>
[pinged] =>
[post_modified] => 2022-10-11 11:33:19
[post_modified_gmt] => 2022-10-11 18:33:19
[post_content_filtered] =>
[post_parent] => 0
[guid] => https://preferredstrategies.com/?post_type=resource&p=6816
[menu_order] => 4
[post_type] => resource
[post_mime_type] =>
[comment_count] => 0
[filter] => raw
)
[4] => WP_Post Object
(
[ID] => 6787
[post_author] => 2
[post_date] => 2020-10-29 14:15:34
[post_date_gmt] => 2020-10-29 22:15:34
[post_content] =>
[post_title] => The Value of Being Data Driven Session 2: Self Service Analytics – A Key to Being Data Driven
[post_excerpt] => Do you have consistent, intuitive access to your business analytics? Get behind the scenes of Power BI to learn how you can tap into powerful self-service analytics.
[post_status] => publish
[comment_status] => closed
[ping_status] => closed
[post_password] =>
[post_name] => data-driven-session-2
[to_ping] =>
[pinged] =>
[post_modified] => 2022-10-11 11:35:46
[post_modified_gmt] => 2022-10-11 18:35:46
[post_content_filtered] =>
[post_parent] => 0
[guid] => https://preferredstrategies.com/?post_type=resource&p=6787
[menu_order] => 7
[post_type] => resource
[post_mime_type] =>
[comment_count] => 0
[filter] => raw
)
[5] => WP_Post Object
(
[ID] => 6788
[post_author] => 2
[post_date] => 2020-10-28 14:16:23
[post_date_gmt] => 2020-10-28 22:16:23
[post_content] =>
[post_title] => The Value of Being Data Driven Session 3: Best Practices Data Model – A 360-Degree View of Your Business
[post_excerpt] => Learn how to use Power BI and QuickLaunch to create a foundation of your JDE or Viewpoint data that delivers actionable information, a single version of the truth, and strong data governance.
[post_status] => publish
[comment_status] => closed
[ping_status] => closed
[post_password] =>
[post_name] => the-value-of-being-data-driven-session-3
[to_ping] =>
[pinged] =>
[post_modified] => 2022-10-11 11:39:02
[post_modified_gmt] => 2022-10-11 18:39:02
[post_content_filtered] =>
[post_parent] => 0
[guid] => https://preferredstrategies.com/?post_type=resource&p=6788
[menu_order] => 6
[post_type] => resource
[post_mime_type] =>
[comment_count] => 0
[filter] => raw
)
[6] => WP_Post Object
(
[ID] => 6789
[post_author] => 2
[post_date] => 2020-10-27 14:17:24
[post_date_gmt] => 2020-10-27 22:17:24
[post_content] =>
[post_title] => The Value of Being Data Driven Session 4: The Potential of Advanced Analytics and How to Get There from Here
[post_excerpt] => Advance your analytics program to places you’ve never imagined. In this session, we’ll help you visualize the full potential of your JDE or Viewpoint data and set clear next steps for reaching your potential.
[post_status] => publish
[comment_status] => closed
[ping_status] => closed
[post_password] =>
[post_name] => the-value-of-being-data-driven-session-4
[to_ping] =>
[pinged] =>
[post_modified] => 2022-10-11 11:41:27
[post_modified_gmt] => 2022-10-11 18:41:27
[post_content_filtered] =>
[post_parent] => 0
[guid] => https://preferredstrategies.com/?post_type=resource&p=6789
[menu_order] => 5
[post_type] => resource
[post_mime_type] =>
[comment_count] => 0
[filter] => raw
)
[7] => WP_Post Object
(
[ID] => 6786
[post_author] => 2
[post_date] => 2020-10-27 14:14:07
[post_date_gmt] => 2020-10-27 22:14:07
[post_content] =>
[post_title] => The Value of Being Data Driven Session 1: Aligning Your Business and Data Strategies
[post_excerpt] => What are your business goals and do you have the right data strategy in place to help you get there? This session will help get your business goals and your data strategies in alignment.
[post_status] => publish
[comment_status] => closed
[ping_status] => closed
[post_password] =>
[post_name] => the-value-of-being-data-driven-session-1-aligning-your-business-and-data-strategies
[to_ping] =>
[pinged] =>
[post_modified] => 2022-10-11 11:43:27
[post_modified_gmt] => 2022-10-11 18:43:27
[post_content_filtered] =>
[post_parent] => 0
[guid] => https://preferredstrategies.com/?post_type=resource&p=6786
[menu_order] => 8
[post_type] => resource
[post_mime_type] =>
[comment_count] => 0
[filter] => raw
)
[8] => WP_Post Object
(
[ID] => 6779
[post_author] => 2
[post_date] => 2020-10-20 09:45:53
[post_date_gmt] => 2020-10-20 17:45:53
[post_content] =>
[post_title] => Sukut Construction
[post_excerpt] => Learn how Sukut used QuickLaunch and PowerBI to create reports and dashboards in a fraction of the time previously required, giving management the data needed to proactively manage the business.
[post_status] => publish
[comment_status] => closed
[ping_status] => closed
[post_password] =>
[post_name] => sukut-construction
[to_ping] =>
[pinged] =>
[post_modified] => 2021-06-23 22:13:54
[post_modified_gmt] => 2021-06-23 22:13:54
[post_content_filtered] =>
[post_parent] => 0
[guid] => https://preferredstrategies.com/?post_type=resource&p=6779
[menu_order] => 20
[post_type] => resource
[post_mime_type] =>
[comment_count] => 0
[filter] => raw
)
)
[post_count] => 9
[current_post] => -1
[before_loop] => 1
[in_the_loop] =>
[post] => WP_Post Object
(
[ID] => 6921
[post_author] => 6
[post_date] => 2021-01-15 10:13:21
[post_date_gmt] => 2021-01-15 18:13:21
[post_content] => When Power BI was released 6 years ago, one of the biggest criticisms was that the platform lacked enterprise scale features for governance and administration, however, over the past couple years the Power BI team has made strides in addressing this concern. In Part 3 of our 2020 in Review series, we will cover new features and enhancements to the product designed to help users who are responsible for administering the usage, deployment, and adoption of Power BI within their organizations. If you missed them, be sure to check out the Part 1 for Consumers and Part 2 for report Designers as well.
Read Part One | Read Part Two

Power BI Admins & Content Managers Updates
Updated Workspaces
The Power BI team made the new workspace experience generally available back in April of 2019 and we are now finally getting to the end of life for the original classic workspaces. We are expecting the classic workspaces to be deprecated by the middle of 2021. You may have noticed that when you create a new Team in the Teams application (or any Office 365 group), a new Power BI classic Workspace is also created with the same name. This is because the classic Workspaces are tied to Office 365 groups which is automatically configured when you create a new team. Because of this, there is now a Power BI tenant setting to address this issue that can block the creation of classic workspaces and hide any classic workspaces that have not been used. The new Workspaces provide many advantages including not being tied to an Office 365 group, more granular workspace permissions, ability to use security groups to manage users, contact lists, better usage metrics, and the ability to use shared datasets across workspaces. As of today, you must manually update workspaces in the workspace settings dialog, but the Power BI team has announced that they will release a way for Admins to bulk upgrade workspaces in 2021. Eventually all classic workspaces will be automatically upgraded. Read More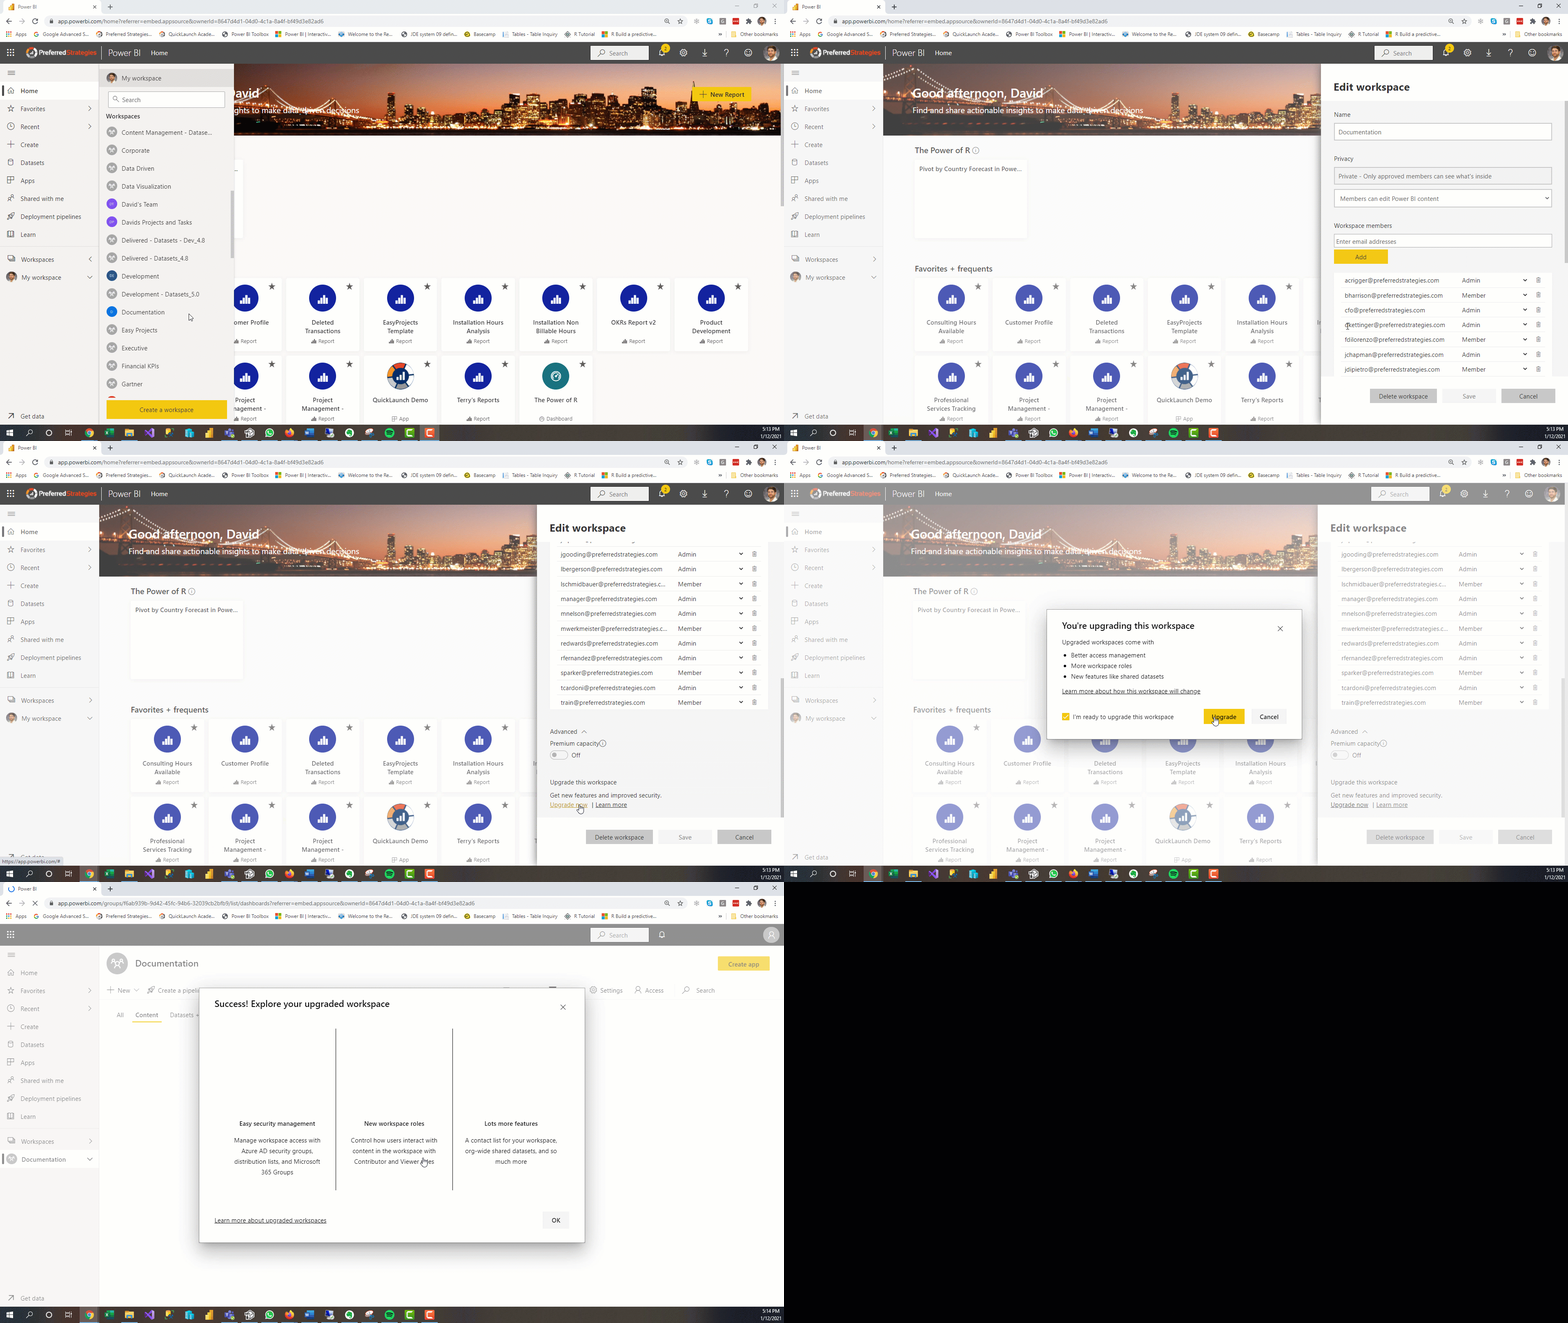 (click to view larger)
Shared and Certified Datasets
In May 2020, the ability to use the same dataset for many different reports across multiple workspaces was made generally available. Shared datasets allows Power BI admins and designers to build their reports connected to one single Dataset in the Power BI Service instead of having to manage many duplicated datasets. In addition, with Dataset Endorsements, datasets can now be promoted and certified as the trusted and authoritative dataset so that users are confident in the data. Read More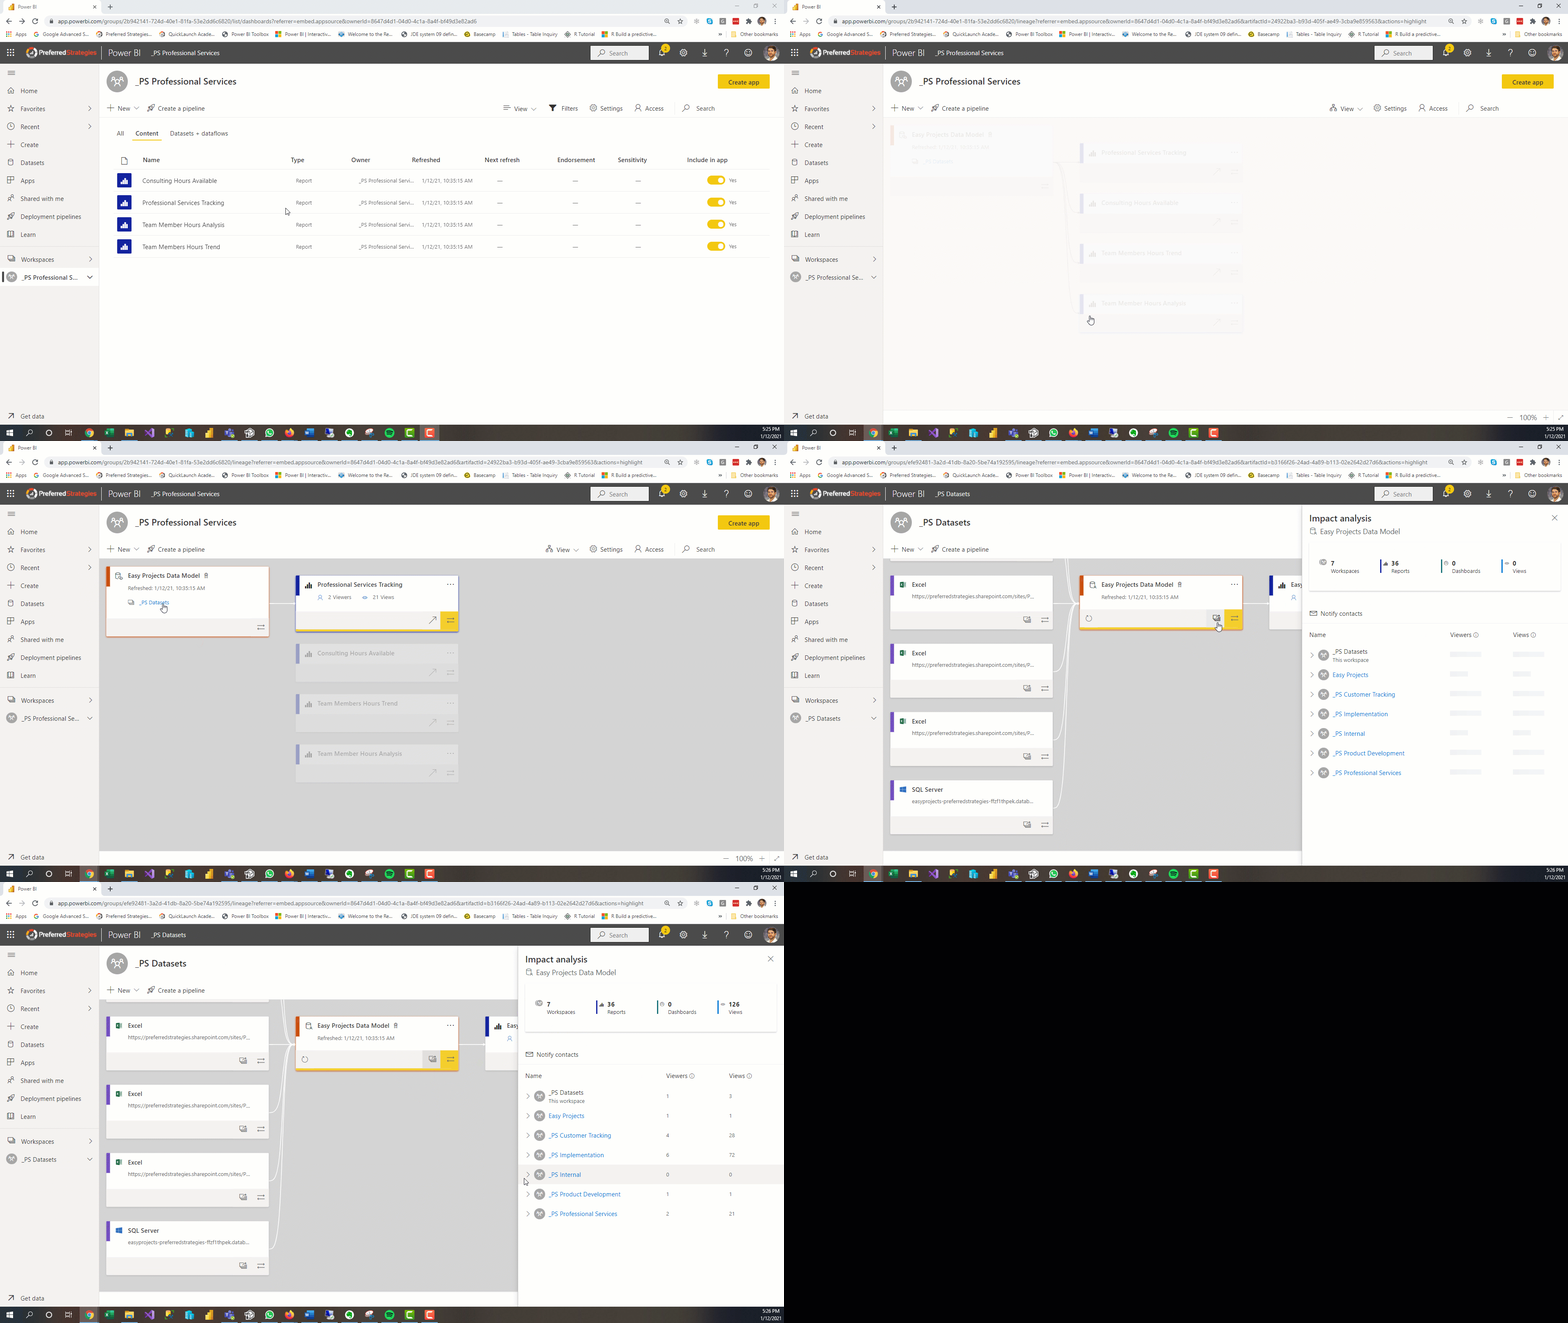 (click to view larger)
Data Source and Dataset Impact Analysis
You may have already seen the dataset impact analysis feature in Power BI that allows you to determine which reports and dashboards are connected to it across different workspaces. This is helpful for understanding which pieces of content will be affected by updates to a dataset. Now there is a similar feature called Data Source impact analysis that always you to click on a data source in the Lineage view of a workspace and see what datasets across the entire tenant use that data source. If you are thinking about modifying a data source than this is a critical feature that will allow you to see the impacts of those changes and alert on stakeholders beforehand. In addition, this feature gives Admins the ability to see what datasets, other than the certified datasets, are using the same data source so that you can reduce dataset redundancy and create a single version of the truth. Dataset Info | Data Source Info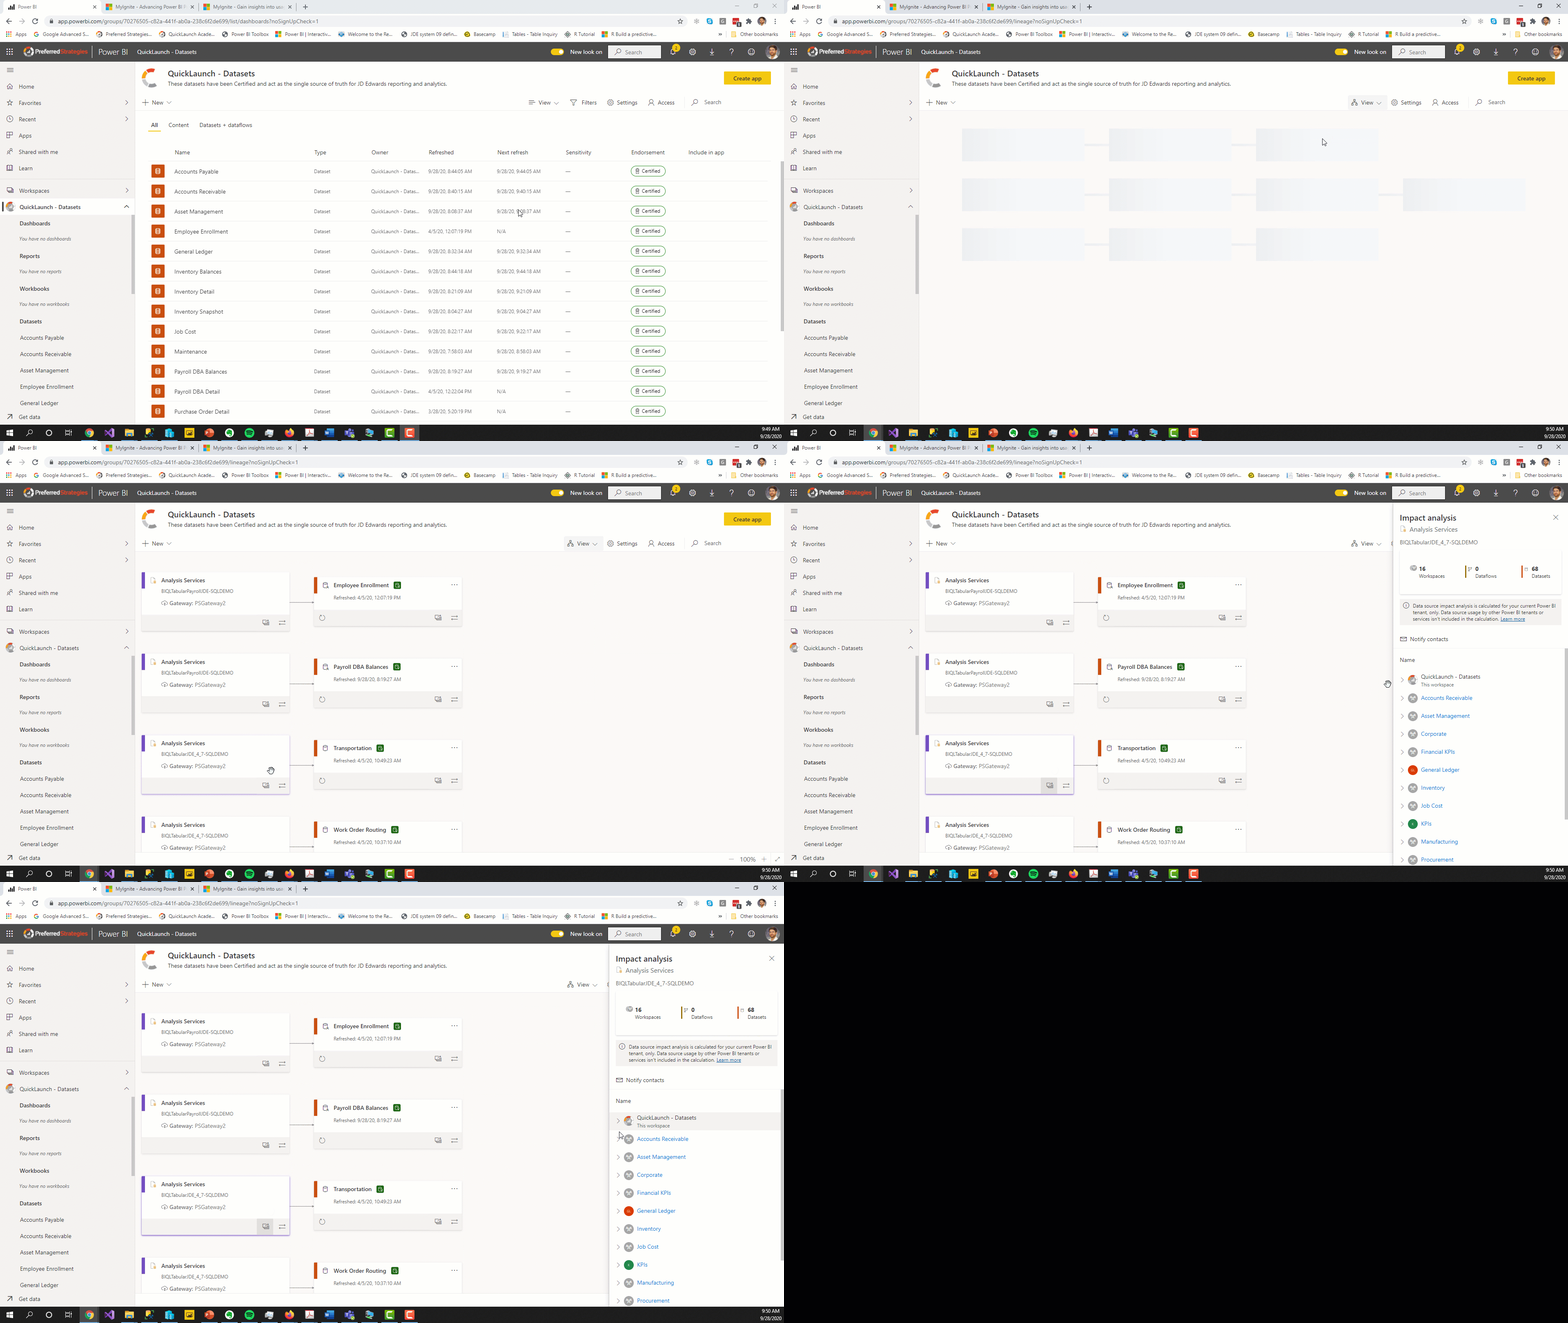 (click to view larger)
Certified Reports and Apps (Preview)
Similar to the ability to endorse datasets, you can now label reports as either Certified, Promoted, or No endorsement. This gives users the assurance that they are making decisions based on information that has been validated and marked as trusted. In addition, content managers and PBI admins have the ability to tightly control and document who has the ability to endorse content to ensure the certification process is selective and governed. This is a great enterprise scale improvement that will help your organization distinguish between the growing number of reports within your company. Read More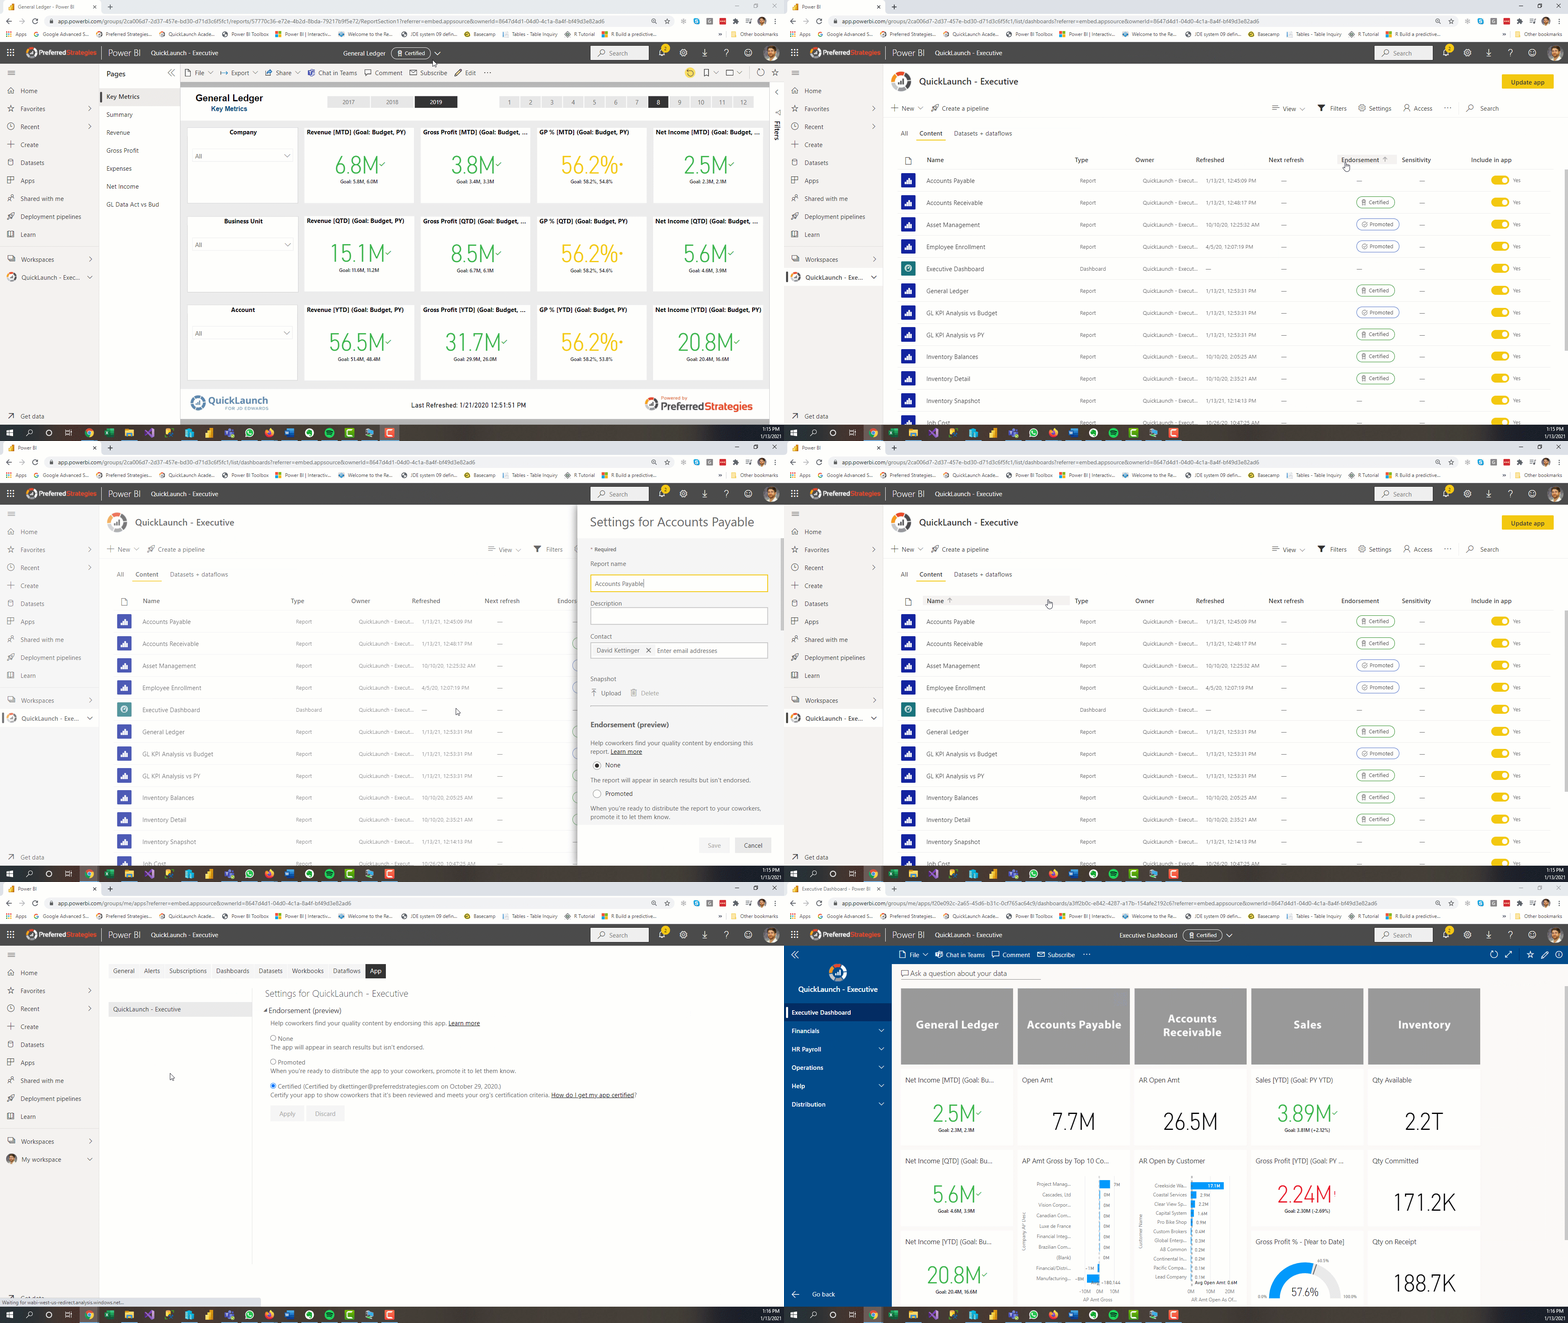 (click to view larger)
Power BI App in Teams
This essentially allows users to have the full Power BI experience right within Teams so they no longer need to use a browser to reach the PBI service. See Part 1 for more information. Read More (click to view larger)
Power BI Premium Gen 2 and Premium Per User (Premium) (Preview)
The next generation of Premium has a lot of updates including new licensing for individuals. There is now a Premium Per User license which is aimed at making PBI Premium more accessible to smaller organizations from a cost standpoint. You can give it a try for free while it is Preview. Read More For existing Premium SKUs, Gen 2 brings performance enhancements to all of the capacities, better monitoring metrics and reporting, and the ability to auto-scale when capacity limits are reached. Read More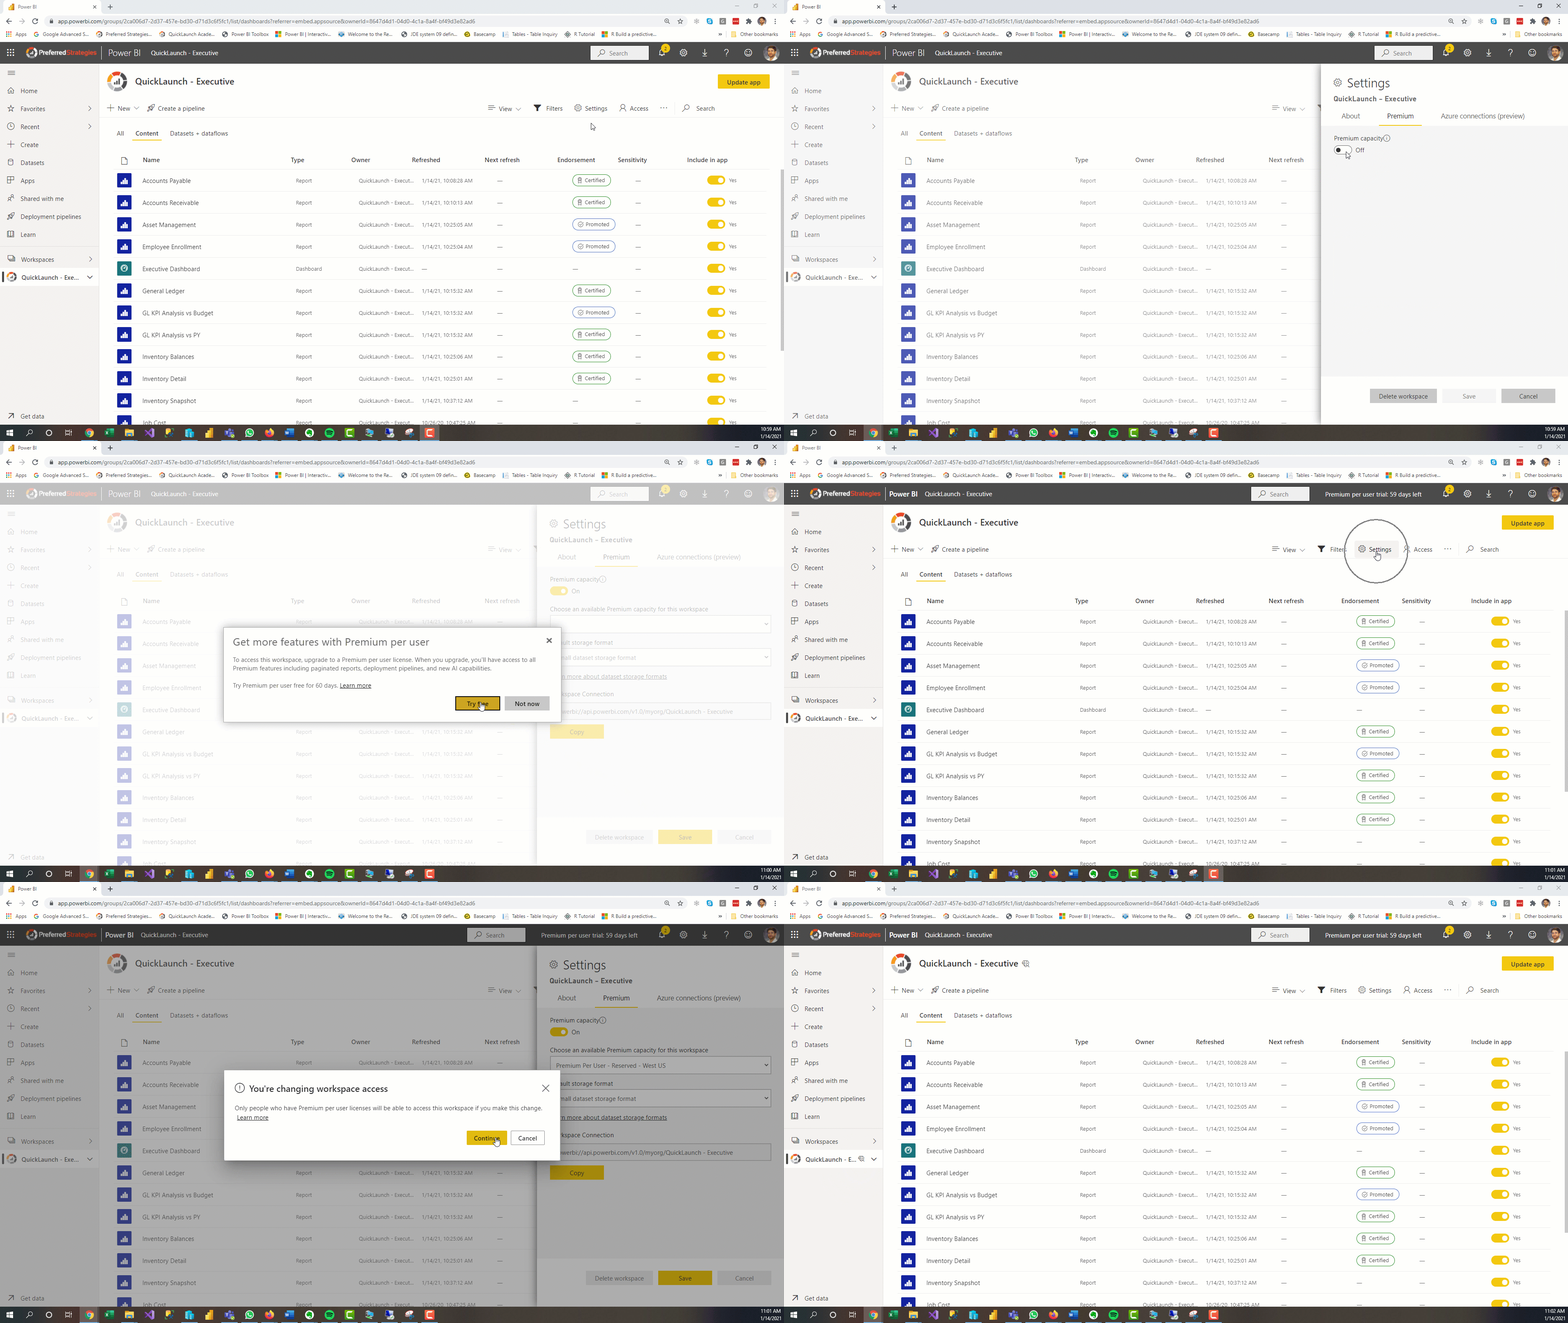 (click to view larger)
Deployment Pipelines (Premium)
Until this year, managing the Power BI content lifecycle was manual and error prone. With the new Deployment Pipelines feature that are part of Power BI Premium, teams can build efficient processes for maintaining development, test, and production environments. Developers can selectively make changes to content in each stage of the life cycle including reconfiguring reports and dashboards to appropriate datasets and then quickly push the updates to the different stages. Read More (click to view larger)
[post_title] => Power BI Updates for QuickLaunch Customers: 2020 in Review - Part 3 - Admins & Content Managers
[post_excerpt] => In the third part of our 2020 in Review series, we cover new features and enhancements to the product designed to help users who are responsible for administering the usage, deployment, and adoption of Power BI within their organizations.
[post_status] => publish
[comment_status] => closed
[ping_status] => open
[post_password] =>
[post_name] => power-bi-updates-quicklaunch-2020-part3
[to_ping] =>
[pinged] =>
[post_modified] => 2023-05-22 16:40:20
[post_modified_gmt] => 2023-05-22 23:40:20
[post_content_filtered] =>
[post_parent] => 0
[guid] => https://preferredstrategies.com/?p=6921
[menu_order] => 4
[post_type] => post
[post_mime_type] =>
[comment_count] => 0
[filter] => raw
)
[comment_count] => 0
[current_comment] => -1
[found_posts] => 112
[max_num_pages] => 13
[max_num_comment_pages] => 0
[is_single] =>
[is_preview] =>
[is_page] =>
[is_archive] =>
[is_date] =>
[is_year] =>
[is_month] =>
[is_day] =>
[is_time] =>
[is_author] =>
[is_category] =>
[is_tag] =>
[is_tax] =>
[is_search] =>
[is_feed] =>
[is_comment_feed] =>
[is_trackback] =>
[is_home] => 1
[is_privacy_policy] =>
[is_404] =>
[is_embed] =>
[is_paged] => 1
[is_admin] =>
[is_attachment] =>
[is_singular] =>
[is_robots] =>
[is_favicon] =>
[is_posts_page] =>
[is_post_type_archive] =>
[query_vars_hash:WP_Query:private] => e1b50b3daeaf36a86d95c6dd218a8838
[query_vars_changed:WP_Query:private] =>
[thumbnails_cached] =>
[allow_query_attachment_by_filename:protected] =>
[stopwords:WP_Query:private] =>
[compat_fields:WP_Query:private] => Array
(
[0] => query_vars_hash
[1] => query_vars_changed
)
[compat_methods:WP_Query:private] => Array
(
[0] => init_query_flags
[1] => parse_tax_query
)
)
In the third part of our 2020 in Review series, we cover new features and enhancements to the product designed to help users who are responsible for administering the usage, deployment, and adoption of Power BI within their organizations.
Designing reports and dashboards in Power BI is exciting because things are constantly being upgraded to make your life easier and more interesting. The Power BI team releases updates for Power BI Desktop on a monthly cadence. In the second part of our 2020 in Review series, we will review some of our favorite updates for Power BI users that are responsible for creating reports and dashboards.
The Power BI team constantly rolls out new features and enhancements to the Power BI platform including updates to the Power BI Desktop, the Power BI Service, and the Power BI Mobile App. While it is awesome that Microsoft is committed to this continuous delivery strategy to quickly push updates into production, sometimes it can feel like drinking out of a firehose when trying to keep up with all the latest news.
In this demo-filled glimpse into the future of analytics, we illustrate some of the unbiased insights that can be gained from a common JDE infrastructure with AI-enabled advanced analytics, natural-language query and generation, and smart data visualization.
Do you have consistent, intuitive access to your business analytics? Get behind the scenes of Power BI to learn how you can tap into powerful self-service analytics.
Learn how to use Power BI and QuickLaunch to create a foundation of your JDE or Viewpoint data that delivers actionable information, a single version of the truth, and strong data governance.
Advance your analytics program to places you’ve never imagined. In this session, we’ll help you visualize the full potential of your JDE or Viewpoint data and set clear next steps for reaching your potential.
What are your business goals and do you have the right data strategy in place to help you get there? This session will help get your business goals and your data strategies in alignment.

Learn how Sukut used QuickLaunch and PowerBI to create reports and dashboards in a fraction of the time previously required, giving management the data needed to proactively manage the business.


