WP_Query Object
(
[query] => Array
(
[post_type] => Array
(
[0] => resource
[1] => post
)
[posts_per_page] => 9
[orderby] => publish_date
[order] => DESC
[paged] => 3
)
[query_vars] => Array
(
[post_type] => Array
(
[0] => resource
[1] => post
)
[posts_per_page] => 9
[orderby] => publish_date
[order] => DESC
[paged] => 3
[error] =>
[m] =>
[p] => 0
[post_parent] =>
[subpost] =>
[subpost_id] =>
[attachment] =>
[attachment_id] => 0
[name] =>
[pagename] =>
[page_id] => 0
[second] =>
[minute] =>
[hour] =>
[day] => 0
[monthnum] => 0
[year] => 0
[w] => 0
[category_name] =>
[tag] =>
[cat] =>
[tag_id] =>
[author] =>
[author_name] =>
[feed] =>
[tb] =>
[meta_key] =>
[meta_value] =>
[preview] =>
[s] =>
[sentence] =>
[title] =>
[fields] =>
[menu_order] =>
[embed] =>
[category__in] => Array
(
)
[category__not_in] => Array
(
)
[category__and] => Array
(
)
[post__in] => Array
(
)
[post__not_in] => Array
(
)
[post_name__in] => Array
(
)
[tag__in] => Array
(
)
[tag__not_in] => Array
(
)
[tag__and] => Array
(
)
[tag_slug__in] => Array
(
)
[tag_slug__and] => Array
(
)
[post_parent__in] => Array
(
)
[post_parent__not_in] => Array
(
)
[author__in] => Array
(
)
[author__not_in] => Array
(
)
[search_columns] => Array
(
)
[ignore_sticky_posts] =>
[suppress_filters] =>
[cache_results] => 1
[update_post_term_cache] => 1
[update_menu_item_cache] =>
[lazy_load_term_meta] => 1
[update_post_meta_cache] => 1
[nopaging] =>
[comments_per_page] => 50
[no_found_rows] =>
)
[tax_query] => WP_Tax_Query Object
(
[queries] => Array
(
)
[relation] => AND
[table_aliases:protected] => Array
(
)
[queried_terms] => Array
(
)
[primary_table] => wp_443ttgh517_posts
[primary_id_column] => ID
)
[meta_query] => WP_Meta_Query Object
(
[queries] => Array
(
)
[relation] =>
[meta_table] =>
[meta_id_column] =>
[primary_table] =>
[primary_id_column] =>
[table_aliases:protected] => Array
(
)
[clauses:protected] => Array
(
)
[has_or_relation:protected] =>
)
[date_query] =>
[request] => SELECT SQL_CALC_FOUND_ROWS wp_443ttgh517_posts.ID
FROM wp_443ttgh517_posts
WHERE 1=1 AND ((wp_443ttgh517_posts.post_type = 'resource' AND (wp_443ttgh517_posts.post_status = 'publish' OR wp_443ttgh517_posts.post_status = 'acf-disabled')) OR (wp_443ttgh517_posts.post_type = 'post' AND (wp_443ttgh517_posts.post_status = 'publish' OR wp_443ttgh517_posts.post_status = 'acf-disabled')))
ORDER BY wp_443ttgh517_posts.post_date DESC
LIMIT 18, 9
[posts] => Array
(
[0] => WP_Post Object
(
[ID] => 9275
[post_author] => 6
[post_date] => 2021-07-07 21:53:17
[post_date_gmt] => 2021-07-07 21:53:17
[post_content] => As the world reopens from the COVID pandemic, the Power BI team has been releasing new features in full force. Q2 has seen a steady stream of updates to all areas of the platform. There have been updates for consuming Power BI content in Teams, SharePoint Online, and the Windows App to bring these experiences closer to the Power BI Service. Highly requested new visuals were released for content designers including the Power Automate and Paginated Report visuals. Finally, there were several very important updates for Power BI Admins such as performance and usage history analysis capabilities and backup and restore for Power BI datasets. In this post we will cover these updates and other top feature updates from the past three months that span consumer, content creator, and admin users.

Power BI Consumers
Enhanced Consumer Experience in SharePoint Online
Organizations that leverage SharePoint sites to host Power BI reports will be pleased with the new action bar that brings the consumer experience from the PBI Service to SharePoint Online.
Read more
 (click to view larger)
Updated Version of the Power BI Windows App
One often overlooked way to consume Power BI Content is through the Windows application. For consumers who do not need to edit reports and do not want the added UI overhead of a web browser, this updated experience may be just the tool. With this update, the PBI Windows app gets an updated look to match the PBI Service and enhancements to performance with changing and background processing.
Read more
 (click to view larger)

Power BI Designers
Modern Visual Tooltips is now in Preview (Preview Feature)
The new visual tooltip feature allows users to perform the drilldown and drillthrough functions right from the tooltip UI instead of using the visual header or right-clicking. It also allows report designers to match tooltip design to the report theme.
 (click to view larger)
Small Multiples Visual Enhancements (Preview Feature)
There have been several updates to the Small Multiples visual over the past few months since we first covered this feature at the end of last year. These include the ability to control gridlines and background colors, word wrap for titles, control for padding and spacing between multiples, support for combo chart visuals, conditional formatting, and the ability to drill on date hierarches.
Read more
 (click to view larger)
Power Automate Visual (Preview Feature)
Allow your report users to take action from within a Power BI Report with the new Power Automate visual. With this new visual, you can let consumers run an automated process or flow that can be contextual to the data selected in filters or slicers on a page.
Read more
 (click to view larger)
Paginated Report Visual (Preview Feature)
With this high requested updated, it is now possible to embed a paginated report that has been uploaded to the PBI Service from within a standard, interactive Power BI Report.
Read more
 (click to view larger)

Power BI Admins & Content Managers
Backup and Restore Power BI Datasets (Preview Feature) (Premium Feature)
This enterprise-grade improvement allows organizations to utilize the backup and restore functionality that many DBAs are used to with traditional Analysis Services deployments. Whether you are trying to provide redundancy in case of corruption or loss, maintain records for compliance with regulations, or consolidate datasets across workspaces or PBI tenants; this new feature will come in handy.
Read more
 (click to view larger)
Historical Usage and Performance Metrics (Preview Feature) (Premium Feature)
Prior to this new feature, the historical reporting on Power BI usage and performance was very complex and was not native to the PBI/Azure architectures. However, now it is possible to analyze performance over time, user activities and metrics for any workspace, as well as figure out which queries or dataset refreshes are taking the most time. This feature requires a connection to an Azure Log Analytics resource in Azure that can capture and retain up to 2 years of information.
Read more
 (click to view larger)
Updated Timeframe for Classic Workspace Upgrades
The Power BI team has pushed the automatic upgrade of Classic Workspaces in the PBI Service to April 2022 which was originally set for this year. In October 2021 there will be a new Upgrade All tool in the PBI Admin portal that will allow Admins to manually upgrade all the workspaces in their tenant simultaneously.
Read more
Object- Level Security (ODS) for Power BI Premium and Pro
Many QuickLaunch customers are currently leveraging row-level security (RLS), however, now there is a new security feature that allows you to secure data model objects at the table and column levels to protect sensitive information. This allows you to hide object names and metadata from the user so that they do not even know it exists.
Read more
 (click to view larger)
Add and Edit Data Sources from the Power Platform Admin Center (Preview Feature)
If you are a Power BI Admin then you need to check out the Power Platform Admin Center. With the latest updates, you can now add new and edit existing cloud and on-premise data sources used by Power Platform programs like Power BI, Automate and PowerApps. This portal will eventually replace the Manage Gateways section of the Power BI Admin portal so it is a good idea to start familiarizing yourself with it soon.
Read more
 (click to view larger)
[post_title] => Power BI Updates for QuickLaunch Customers: Q2 2021
[post_excerpt] => The Power BI team has been releasing new features in full force. Q2 has seen a steady stream of updates to all areas of the platform.
[post_status] => publish
[comment_status] => closed
[ping_status] => open
[post_password] =>
[post_name] => power-bi-updates-q2-2021
[to_ping] =>
[pinged] =>
[post_modified] => 2023-05-22 16:40:17
[post_modified_gmt] => 2023-05-22 23:40:17
[post_content_filtered] =>
[post_parent] => 0
[guid] => https://preferredstrategies.com/?p=9275
[menu_order] => 0
[post_type] => post
[post_mime_type] =>
[comment_count] => 0
[filter] => raw
)
[1] => WP_Post Object
(
[ID] => 8987
[post_author] => 2
[post_date] => 2021-06-25 22:01:32
[post_date_gmt] => 2021-06-25 22:01:32
[post_content] =>
[post_title] => An Inside Look at How IGI Wax Envisions Their Future with QuickLaunch
[post_excerpt] => In this on-demand recording, you’ll hear an update on the IGI Wax data-driven journey, learn about their next steps, uncover lessons learned, and get an inside look at their continued success with data-driven initiatives.
[post_status] => publish
[comment_status] => closed
[ping_status] => closed
[post_password] =>
[post_name] => an-inside-look-at-how-igi-wax-envisions-their-future-with-quicklaunch
[to_ping] =>
[pinged] =>
[post_modified] => 2022-10-11 10:52:11
[post_modified_gmt] => 2022-10-11 17:52:11
[post_content_filtered] =>
[post_parent] => 0
[guid] => https://preferredstrategies.com/?post_type=resource&p=8987
[menu_order] => 0
[post_type] => resource
[post_mime_type] =>
[comment_count] => 0
[filter] => raw
)
[2] => WP_Post Object
(
[ID] => 8656
[post_author] => 2
[post_date] => 2021-06-18 22:21:26
[post_date_gmt] => 2021-06-18 22:21:26
[post_content] =>
[post_title] => Trends in ERP Adoption in Construction
[post_excerpt] => Ben Harrison, vice president of product management at Preferred Strategies, discusses trends in the adoption of Enterprise Resource Planning (ERP) in the construction industry and how QuickLaunch can help contractors better utilize ERP data to its full potential.
[post_status] => publish
[comment_status] => closed
[ping_status] => closed
[post_password] =>
[post_name] => trends-in-erp-adoption-in-construction
[to_ping] =>
[pinged] =>
[post_modified] => 2021-08-02 19:36:39
[post_modified_gmt] => 2021-08-02 19:36:39
[post_content_filtered] =>
[post_parent] => 0
[guid] => https://preferredstrategies.com/?post_type=resource&p=8656
[menu_order] => 0
[post_type] => resource
[post_mime_type] =>
[comment_count] => 0
[filter] => raw
)
[3] => WP_Post Object
(
[ID] => 7214
[post_author] => 2
[post_date] => 2021-04-27 12:20:13
[post_date_gmt] => 2021-04-27 20:20:13
[post_content] =>
[post_title] => How to Build Interactive JDE Reports with QuickLaunch and Power BI
[post_excerpt] => Learn how to build interactive JD Edwards reports using modern BI tools. For illustrative purposes, we will use Preferred Strategies QuickLaunch and the free, cloud-based version of Microsoft Power BI as the BI tools.
[post_status] => publish
[comment_status] => closed
[ping_status] => closed
[post_password] =>
[post_name] => how-to-build-interactive-jde-reports-with-quicklaunch-and-power-bi-2
[to_ping] =>
[pinged] =>
[post_modified] => 2022-10-21 14:24:47
[post_modified_gmt] => 2022-10-21 21:24:47
[post_content_filtered] =>
[post_parent] => 0
[guid] => https://preferredstrategies.com/?post_type=resource&p=7214
[menu_order] => 16
[post_type] => resource
[post_mime_type] =>
[comment_count] => 0
[filter] => raw
)
[4] => WP_Post Object
(
[ID] => 7149
[post_author] => 2
[post_date] => 2021-03-26 12:54:06
[post_date_gmt] => 2021-03-26 20:54:06
[post_content] =>
[post_title] => Show Me the Money: Visualizing Your Cash Flow
[post_excerpt] => Watch this session to learn some visualization options for both macro and micro cash flow analysis at your company.
[post_status] => publish
[comment_status] => closed
[ping_status] => closed
[post_password] =>
[post_name] => show-me-the-money-visualizing-your-cash-flow
[to_ping] =>
[pinged] =>
[post_modified] => 2022-10-11 11:11:05
[post_modified_gmt] => 2022-10-11 18:11:05
[post_content_filtered] =>
[post_parent] => 0
[guid] => https://preferredstrategies.com/?post_type=resource&p=7149
[menu_order] => 2
[post_type] => resource
[post_mime_type] =>
[comment_count] => 0
[filter] => raw
)
[5] => WP_Post Object
(
[ID] => 7127
[post_author] => 6
[post_date] => 2021-03-23 13:40:22
[post_date_gmt] => 2021-03-23 21:40:22
[post_content] => Power BI was named a leader in the Gartner magic quadrant again this year. (Be sure to check out our interactive analysis of the Magic quadrant here.) A major factor of Power BI's success has been the dedication by Microsoft to continuously improve the Power BI product suite with updates that are demand-driven and consistent.
We were planning on releasing future installments of this blog series on a monthly cadence, however, updates started off a little slow this year with no monthly update to the Power BI Desktop product in January and just a few updates in February, so we decided to include all updates from Q1 of 2021 in this post.
(click to view larger)
[post_title] => Power BI Updates for QuickLaunch Customers: Q2 2021
[post_excerpt] => The Power BI team has been releasing new features in full force. Q2 has seen a steady stream of updates to all areas of the platform.
[post_status] => publish
[comment_status] => closed
[ping_status] => open
[post_password] =>
[post_name] => power-bi-updates-q2-2021
[to_ping] =>
[pinged] =>
[post_modified] => 2023-05-22 16:40:17
[post_modified_gmt] => 2023-05-22 23:40:17
[post_content_filtered] =>
[post_parent] => 0
[guid] => https://preferredstrategies.com/?p=9275
[menu_order] => 0
[post_type] => post
[post_mime_type] =>
[comment_count] => 0
[filter] => raw
)
[1] => WP_Post Object
(
[ID] => 8987
[post_author] => 2
[post_date] => 2021-06-25 22:01:32
[post_date_gmt] => 2021-06-25 22:01:32
[post_content] =>
[post_title] => An Inside Look at How IGI Wax Envisions Their Future with QuickLaunch
[post_excerpt] => In this on-demand recording, you’ll hear an update on the IGI Wax data-driven journey, learn about their next steps, uncover lessons learned, and get an inside look at their continued success with data-driven initiatives.
[post_status] => publish
[comment_status] => closed
[ping_status] => closed
[post_password] =>
[post_name] => an-inside-look-at-how-igi-wax-envisions-their-future-with-quicklaunch
[to_ping] =>
[pinged] =>
[post_modified] => 2022-10-11 10:52:11
[post_modified_gmt] => 2022-10-11 17:52:11
[post_content_filtered] =>
[post_parent] => 0
[guid] => https://preferredstrategies.com/?post_type=resource&p=8987
[menu_order] => 0
[post_type] => resource
[post_mime_type] =>
[comment_count] => 0
[filter] => raw
)
[2] => WP_Post Object
(
[ID] => 8656
[post_author] => 2
[post_date] => 2021-06-18 22:21:26
[post_date_gmt] => 2021-06-18 22:21:26
[post_content] =>
[post_title] => Trends in ERP Adoption in Construction
[post_excerpt] => Ben Harrison, vice president of product management at Preferred Strategies, discusses trends in the adoption of Enterprise Resource Planning (ERP) in the construction industry and how QuickLaunch can help contractors better utilize ERP data to its full potential.
[post_status] => publish
[comment_status] => closed
[ping_status] => closed
[post_password] =>
[post_name] => trends-in-erp-adoption-in-construction
[to_ping] =>
[pinged] =>
[post_modified] => 2021-08-02 19:36:39
[post_modified_gmt] => 2021-08-02 19:36:39
[post_content_filtered] =>
[post_parent] => 0
[guid] => https://preferredstrategies.com/?post_type=resource&p=8656
[menu_order] => 0
[post_type] => resource
[post_mime_type] =>
[comment_count] => 0
[filter] => raw
)
[3] => WP_Post Object
(
[ID] => 7214
[post_author] => 2
[post_date] => 2021-04-27 12:20:13
[post_date_gmt] => 2021-04-27 20:20:13
[post_content] =>
[post_title] => How to Build Interactive JDE Reports with QuickLaunch and Power BI
[post_excerpt] => Learn how to build interactive JD Edwards reports using modern BI tools. For illustrative purposes, we will use Preferred Strategies QuickLaunch and the free, cloud-based version of Microsoft Power BI as the BI tools.
[post_status] => publish
[comment_status] => closed
[ping_status] => closed
[post_password] =>
[post_name] => how-to-build-interactive-jde-reports-with-quicklaunch-and-power-bi-2
[to_ping] =>
[pinged] =>
[post_modified] => 2022-10-21 14:24:47
[post_modified_gmt] => 2022-10-21 21:24:47
[post_content_filtered] =>
[post_parent] => 0
[guid] => https://preferredstrategies.com/?post_type=resource&p=7214
[menu_order] => 16
[post_type] => resource
[post_mime_type] =>
[comment_count] => 0
[filter] => raw
)
[4] => WP_Post Object
(
[ID] => 7149
[post_author] => 2
[post_date] => 2021-03-26 12:54:06
[post_date_gmt] => 2021-03-26 20:54:06
[post_content] =>
[post_title] => Show Me the Money: Visualizing Your Cash Flow
[post_excerpt] => Watch this session to learn some visualization options for both macro and micro cash flow analysis at your company.
[post_status] => publish
[comment_status] => closed
[ping_status] => closed
[post_password] =>
[post_name] => show-me-the-money-visualizing-your-cash-flow
[to_ping] =>
[pinged] =>
[post_modified] => 2022-10-11 11:11:05
[post_modified_gmt] => 2022-10-11 18:11:05
[post_content_filtered] =>
[post_parent] => 0
[guid] => https://preferredstrategies.com/?post_type=resource&p=7149
[menu_order] => 2
[post_type] => resource
[post_mime_type] =>
[comment_count] => 0
[filter] => raw
)
[5] => WP_Post Object
(
[ID] => 7127
[post_author] => 6
[post_date] => 2021-03-23 13:40:22
[post_date_gmt] => 2021-03-23 21:40:22
[post_content] => Power BI was named a leader in the Gartner magic quadrant again this year. (Be sure to check out our interactive analysis of the Magic quadrant here.) A major factor of Power BI's success has been the dedication by Microsoft to continuously improve the Power BI product suite with updates that are demand-driven and consistent.
We were planning on releasing future installments of this blog series on a monthly cadence, however, updates started off a little slow this year with no monthly update to the Power BI Desktop product in January and just a few updates in February, so we decided to include all updates from Q1 of 2021 in this post.
Power BI Consumers
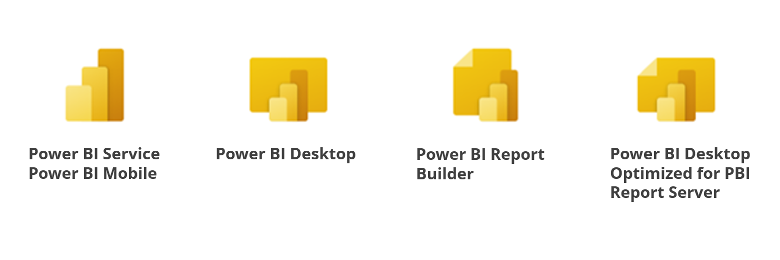
New Power BI Icons
The latest version of Power BI icons has been released so keep your eyes peeled for these new, more stylized images.
Supported Browsers
Users that are still using the legacy version of the Microsoft Edge browser need to update their browser by March 9th, 2021 and users using Internet Explorer 11 need to upgrade by August 17, 2021 as Power BI will no longer support these. You should plan on keeping your browsers up to date anyways to ensure maximum performance while interacting with content in the Power BI Service.
Updated Subscription Attachments (Premium Feature)
Currently for Pro licensed users, you can only subscribe to one page of a report per subscription. This is a limitation if you have multiple pages in your report and you or a recipient want all the pages in the report included. However, with this latest update, subscriptions to reports in an Upgraded V2 Premium or Premium Per User workspace can be configured to include a full version of the report as a PDF or PowerPoint attachment. In addition, you can also subscribe other users in your organization, but the data sent to others will be based on your permissions so if you have row-level security in place, be cautious of this.
Read More
Power BI Designers
Datasets Hub in PBI Service (Preview Feature)
Easily explore all the Datasets you have access to in the new Dataset Hub in the Power BI Service and in the Power BI App for Teams. With this new dataset details portal in Power BI, you can quickly get important metadata such as the last refreshed date, endorsement information (i.e. promoted vs certified), lineage information to show data sources (i.e. SQL or Analysis Services servers), and view which reports are built from the datasets as well as usage metrics per report.
Read More
New Release of Power BI Report Builder
Do not get too excited here. It is still the same Report Builder from the early 2000s with a new name and a few new shiny buttons. The latest version of the PBI Report Builder application includes a similar publishing experience to publishing reports in PBI Desktop. There is now a Publish button on the home ribbon that allows you to quickly make changes to reports and save them back to a workspace in the PBI Service.
Read More
Search in Power BI Desktop
While the number of new features and properties that have been added to the Power BI Desktop over the past 6 years has been incredible, it also makes it harder for new users (and veterans) to find what they are looking for. The new search feature in PBI desktop is very useful for navigating the increasingly complex UI.
Change Log for Power BI Desktop
Over the past few years, many people have asked why there is an update notification in the PBI desktop even though they have downloaded the last monthly release. The answer to this is the PBI team releases different versions outside of the monthly cadence to fix bugs and other issues. There is now a Change Log for all the known fixes that you can use to track specifics of different versions.
Note: If you download installation files from Microsoft to install PBI Desktop, you will have to manually keep downloading the latest version. The preferred method is to install PBI Desktop from the Microsoft Store so that new releases are automatically downloaded and installed for you.
You can see an archive of all the past PBI updates here.
Power BI Admins & Content Managers
Power BI Premium Per User Licensing (PPU) (Preview Feature) (Premium Feature)
We covered this update back in December but now we have more clarity on pricing and availability. One of the biggest complaints about Power BI Premium for the past several years has been the cost barrier to entry for small to medium sized companies, however, this has been resolved with the announcement that PPU will cost $20 per user with existing Power BI Pro users only having to pay an additional $10 per user.
Read More
Read/Write XMLA Endpoints are Generally Available (Premium Feature)
With XMLA endpoints, developers can connect to the Analysis Services engine powering datasets in the Power BI Service. This allows users to connect enterprise BI tools such as Visual Studio (SSDT), SQL Server Management Studio (SSMS), Tabular Editor, DAX Studio, and many others directly to Power BI datasets in the Service enabling application lifecycle management, governance, debugging, and monitoring all within the Power BI ecosystem.
Read More
 [post_title] => Power BI Updates for QuickLaunch Customers: Q1 2021
[post_excerpt] => Power BI was named a leader in the Gartner magic quadrant again this year. (Be sure to check out our interactive analysis of the Magic quadrant here.) A major factor of Power BI’s success has been the dedication by Microsoft to continuously improve the Power BI product suite with updates that are demand-driven and consistent.
[post_status] => publish
[comment_status] => closed
[ping_status] => open
[post_password] =>
[post_name] => power-bi-updates-q1-2021
[to_ping] =>
[pinged] =>
[post_modified] => 2023-05-22 16:40:18
[post_modified_gmt] => 2023-05-22 23:40:18
[post_content_filtered] =>
[post_parent] => 0
[guid] => https://preferredstrategies.com/?p=7127
[menu_order] => 0
[post_type] => post
[post_mime_type] =>
[comment_count] => 0
[filter] => raw
)
[6] => WP_Post Object
(
[ID] => 7086
[post_author] => 6
[post_date] => 2021-03-08 13:00:44
[post_date_gmt] => 2021-03-08 21:00:44
[post_content] => In this article we showcase an interactive version of the Gartner Magic Quadrant for Analytics and Business Intelligence (ABI) built using Microsoft’s Power BI platform. Using this interactive view of the data, you can see how vendors have trended over the past 11 years.
[post_title] => Power BI Updates for QuickLaunch Customers: Q1 2021
[post_excerpt] => Power BI was named a leader in the Gartner magic quadrant again this year. (Be sure to check out our interactive analysis of the Magic quadrant here.) A major factor of Power BI’s success has been the dedication by Microsoft to continuously improve the Power BI product suite with updates that are demand-driven and consistent.
[post_status] => publish
[comment_status] => closed
[ping_status] => open
[post_password] =>
[post_name] => power-bi-updates-q1-2021
[to_ping] =>
[pinged] =>
[post_modified] => 2023-05-22 16:40:18
[post_modified_gmt] => 2023-05-22 23:40:18
[post_content_filtered] =>
[post_parent] => 0
[guid] => https://preferredstrategies.com/?p=7127
[menu_order] => 0
[post_type] => post
[post_mime_type] =>
[comment_count] => 0
[filter] => raw
)
[6] => WP_Post Object
(
[ID] => 7086
[post_author] => 6
[post_date] => 2021-03-08 13:00:44
[post_date_gmt] => 2021-03-08 21:00:44
[post_content] => In this article we showcase an interactive version of the Gartner Magic Quadrant for Analytics and Business Intelligence (ABI) built using Microsoft’s Power BI platform. Using this interactive view of the data, you can see how vendors have trended over the past 11 years.
What is the Magic Quadrant?
Every year, Gartner, an independent technology research firm, publishes a graphical representation of the ABI market in the form of a “Magic Quadrant” (MQ) report. The purpose of this analysis is to summarize a company’s ability to deliver their solution based on their current vision compared to market standards and other competing technologies.
Simply put, a quadrant is four areas made when a plane is divided by an X and Y axis. In this case, the X axis measures the Completeness of Vision or the company’s recent history of innovation and direction of their product. The Y axis measures the vendor’s Ability to Execute on their vision. Gartner uses a defined set of criteria across 12 critical capability areas to score where a company is positioned on each axis and a point is plotted at the intersection of these values to give the vendor’s position within the MQ.
The four sections or quadrants a vendor can fall into include:
1. Leaders
These companies have separated themselves from the competition by demonstrating their ability to execute today’s standards and have proven themselves with past success along with a clear product roadmap that includes the technological standards of the future.
2. Visionaries
Vendors in this category recognize the future direction of the data analytics market and have a vision for implementing these new standards but do not yet execute this vision well.
3. Challengers
This group of vendors are performing well by today’s standards but lack the vision of what the future of the data analytics market will demand or have no clear plan on how to get there.
4. Niche Players
These players usually specialize in a small sector of the overall data analytics marketplace and do not have a plan for expanding their vision. Or they do not specialize but lack the ability to out-innovate and outperform other competitors.
Where does Microsoft fit in?
In 2016, Preferred Strategies, shifted from a primarily SAP focused firm to a Microsoft shop after noticing the momentum that Power BI and related SQL Server and Azure technologies had in the data analytics marketplace. At this time, the scene was really dominated by three vendors: Microsoft, Tableau, and Qlik. In the image below, you can see how Microsoft has separated themselves from the pack over the past 3 years to become the dominate leader in the data analytics space.
 Microsoft has been in the Leaders quadrant for the past 14 years. During the past 5 years, their dominance has stemmed from the success of Power BI, which has been adopted by over 250,000 organizations including 97% of Fortune 500 companies. Microsoft attributes this success to three main points including:
1. Industry leading BI capabilities
Cutting edge visualization functionality with the familiarity of Microsoft Office tools. Microsoft is committed to infusing AI technologies throughout the entire platform to create a revolutionary augmented analytics experience.
2. Fully governed & trusted
Power BI is built on the mature and rapidly evolving Azure cloud infrastructure which has Microsoft Information Protection and Microsoft Cloud App security included.
3. Best economics
At $10 per user per month for Pro and with Power BI Pro included in Office E5 licenses, the cost of owning Power BI is between a quarter to a third of the price of other platforms. This means organizations can deliver insights to everyone without worrying about the bottom line.
Overview of PBI Report
The report below gives you the ability to track how the different vendors have performed over the past 11 years within the dynamic scatter chart with a play axis on the bottom. If you select a data point (or CTRL click multiple data points), you can see a traced trend path for the selected vendor(s). In addition, you can observe the variances for each axis value in the bar chart. You can narrow the report down to specific years and vendors using the slicers in the top of the page. Click on the help icon in the top of the report to see helpful information about using the report.
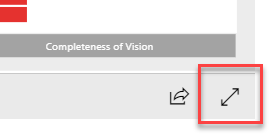 Note: Click the expanding arrows in the bottom right of the report, to view in Full Screen.
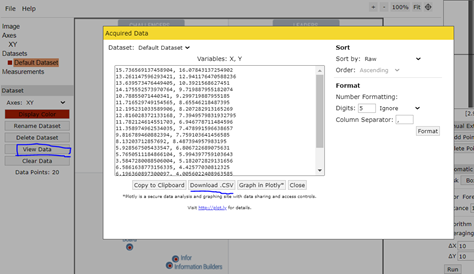
About the Dataset
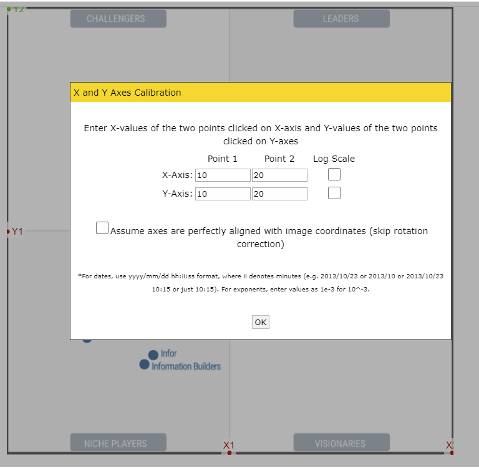
To create the dataset for the report, we took images of the past 11 years of Magic Quadrants and loaded them into a web tool called the Web Plot Digitizer. Once the image is in the web tool, we assigned numerical values to the axes. In this case we chose a scale of 0 – 20 but a different scale could be used such as 0 – 100. Although this is not necessarily the scale that Gartner uses, it still works great for our primary purpose which was to show a year over year trend of the different vendor positions.
Step 1: Load images in the web tool, calibrate the axes, and set the scale.
 Step 2: Plot a coordinate on the digitized quadrant in the middle of each vendor data point.
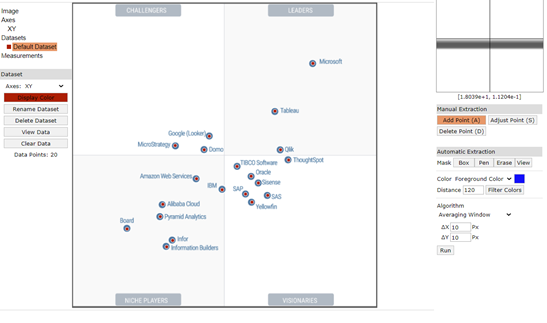 Step 3: Export coordinates data to CSV file and then create a column for vendor and year. Load data into Power BI.
Getting started with these tools and Preferred Strategies
If you are interested in getting started with Power BI, you can download Power BI Desktop for free and begin creating reports like this today. At Preferred Strategies, we specialize in helping organizations connect their Enterprise Resource Planning systems and other common data sources to Power BI. With our QuickLaunch solutions, you can quickly get up and running analyzing your corporate data in a matter of weeks.
[post_title] => Interactive Gartner Magic Quadrant for Analytics Trend Analysis
[post_excerpt] => In this article we showcase an interactive version of the Gartner Magic Quadrant for Analytics and Business Intelligence (ABI) built using Microsoft’s Power BI platform. Using this interactive view of the data, you can see how vendors have trended over the past 11 years.
[post_status] => publish
[comment_status] => closed
[ping_status] => open
[post_password] =>
[post_name] => interactive-gartner-magic-quadrant-analytics-power-bi
[to_ping] =>
[pinged] =>
[post_modified] => 2023-05-22 16:40:19
[post_modified_gmt] => 2023-05-22 23:40:19
[post_content_filtered] =>
[post_parent] => 0
[guid] => https://preferredstrategies.com/?p=7086
[menu_order] => 1
[post_type] => post
[post_mime_type] =>
[comment_count] => 0
[filter] => raw
)
[7] => WP_Post Object
(
[ID] => 7071
[post_author] => 2
[post_date] => 2021-02-19 12:27:19
[post_date_gmt] => 2021-02-19 20:27:19
[post_content] =>
[post_title] => How Power BI Changed Analytics at IGI Wax
[post_excerpt] => In this Q&A session with Bill Sandblom, MIS Director at International Group, Inc. (IGI Wax), Bill shares IGI’s digital transformation journey and explains how the company experienced a three-year head start with QuickLaunch for Power BI.
[post_status] => publish
[comment_status] => closed
[ping_status] => closed
[post_password] =>
[post_name] => how-power-bi-changed-analytics-at-igi-wax
[to_ping] =>
[pinged] =>
[post_modified] => 2022-10-11 11:14:14
[post_modified_gmt] => 2022-10-11 18:14:14
[post_content_filtered] =>
[post_parent] => 0
[guid] => https://preferredstrategies.com/?post_type=resource&p=7071
[menu_order] => 3
[post_type] => resource
[post_mime_type] =>
[comment_count] => 0
[filter] => raw
)
[8] => WP_Post Object
(
[ID] => 7035
[post_author] => 4
[post_date] => 2021-02-02 14:47:52
[post_date_gmt] => 2021-02-02 22:47:52
[post_content] => Deciding to pull the plug on an Analytics Solution can be a difficult decision that many companies unduly postpone. When the technology solution can no longer support your business strategy, you must take action. For instance, your business may decide that becoming Data Driven is imperative to grow your revenues. Becoming data driven requires more people doing more analysis with more data in order to gain insights into the business that were previously unobtainable. If your current solution can’t support this business strategy, it is time to pull the plug on it.
Since IT investments are invariably expensive, all IT investments should be tied to a business strategy. Companies should fully understand the benefit to be gained and the costs to be incurred in the new solution. In the example of becoming data driven, if your IT infrastructure and users still rely heavily on exporting data to spreadsheets, your efforts to transform will fail. It’s simply impossible to achieve the future state by continuing to do more of what you have done in the past.
Change is always difficult, so at least two groups need to be consulted (or informed) before making the change. First, the analytics solution needs to have senior executive support. In the case of becoming data driven, that often is the result of an executive initiative anyway. The second group is the employees who use the old technology and who will be more resistant to the change. This group will need to know three things; why the new technology is important to the company, that they will be trained in the new solution (aka everything will be OK in the end), and that senior management is committed to the change.
Analytics solutions need to have a complete project plan which includes budgets, schedules, training, and someone to manage the process (a project manager). Usually, a phased transition will be more successful than a ‘big bang’ cutover.
Preferred Strategies specializes in helping customers advance in their Data Driven journey. Please contact us if you want to discuss how we can help you.
[post_title] => When to Pull the Plug on an Analytics Solution
[post_excerpt] => Deciding to pull the plug on an Analytics Solution can be a difficult decision that many companies unduly postpone.
[post_status] => publish
[comment_status] => closed
[ping_status] => open
[post_password] =>
[post_name] => pull-plug-analytics-solution
[to_ping] =>
[pinged] =>
[post_modified] => 2023-05-22 16:40:19
[post_modified_gmt] => 2023-05-22 23:40:19
[post_content_filtered] =>
[post_parent] => 0
[guid] => https://preferredstrategies.com/?p=7035
[menu_order] => 3
[post_type] => post
[post_mime_type] =>
[comment_count] => 0
[filter] => raw
)
)
[post_count] => 9
[current_post] => -1
[before_loop] => 1
[in_the_loop] =>
[post] => WP_Post Object
(
[ID] => 9275
[post_author] => 6
[post_date] => 2021-07-07 21:53:17
[post_date_gmt] => 2021-07-07 21:53:17
[post_content] => As the world reopens from the COVID pandemic, the Power BI team has been releasing new features in full force. Q2 has seen a steady stream of updates to all areas of the platform. There have been updates for consuming Power BI content in Teams, SharePoint Online, and the Windows App to bring these experiences closer to the Power BI Service. Highly requested new visuals were released for content designers including the Power Automate and Paginated Report visuals. Finally, there were several very important updates for Power BI Admins such as performance and usage history analysis capabilities and backup and restore for Power BI datasets. In this post we will cover these updates and other top feature updates from the past three months that span consumer, content creator, and admin users.
Power BI Consumers
Enhanced Consumer Experience in SharePoint Online
Organizations that leverage SharePoint sites to host Power BI reports will be pleased with the new action bar that brings the consumer experience from the PBI Service to SharePoint Online.
Read more
(click to view larger)
Updated Version of the Power BI Windows App
One often overlooked way to consume Power BI Content is through the Windows application. For consumers who do not need to edit reports and do not want the added UI overhead of a web browser, this updated experience may be just the tool. With this update, the PBI Windows app gets an updated look to match the PBI Service and enhancements to performance with changing and background processing.
Read more
(click to view larger)
Power BI Designers
Modern Visual Tooltips is now in Preview (Preview Feature)
The new visual tooltip feature allows users to perform the drilldown and drillthrough functions right from the tooltip UI instead of using the visual header or right-clicking. It also allows report designers to match tooltip design to the report theme.
(click to view larger)
Small Multiples Visual Enhancements (Preview Feature)
There have been several updates to the Small Multiples visual over the past few months since we first covered this feature at the end of last year. These include the ability to control gridlines and background colors, word wrap for titles, control for padding and spacing between multiples, support for combo chart visuals, conditional formatting, and the ability to drill on date hierarches.
Read more
(click to view larger)
Power Automate Visual (Preview Feature)
Allow your report users to take action from within a Power BI Report with the new Power Automate visual. With this new visual, you can let consumers run an automated process or flow that can be contextual to the data selected in filters or slicers on a page.
Read more
(click to view larger)
Paginated Report Visual (Preview Feature)
With this high requested updated, it is now possible to embed a paginated report that has been uploaded to the PBI Service from within a standard, interactive Power BI Report.
Read more
(click to view larger)
Power BI Admins & Content Managers
Backup and Restore Power BI Datasets (Preview Feature) (Premium Feature)
This enterprise-grade improvement allows organizations to utilize the backup and restore functionality that many DBAs are used to with traditional Analysis Services deployments. Whether you are trying to provide redundancy in case of corruption or loss, maintain records for compliance with regulations, or consolidate datasets across workspaces or PBI tenants; this new feature will come in handy.
Read more
(click to view larger)
Historical Usage and Performance Metrics (Preview Feature) (Premium Feature)
Prior to this new feature, the historical reporting on Power BI usage and performance was very complex and was not native to the PBI/Azure architectures. However, now it is possible to analyze performance over time, user activities and metrics for any workspace, as well as figure out which queries or dataset refreshes are taking the most time. This feature requires a connection to an Azure Log Analytics resource in Azure that can capture and retain up to 2 years of information.
Read more
(click to view larger)
Updated Timeframe for Classic Workspace Upgrades
The Power BI team has pushed the automatic upgrade of Classic Workspaces in the PBI Service to April 2022 which was originally set for this year. In October 2021 there will be a new Upgrade All tool in the PBI Admin portal that will allow Admins to manually upgrade all the workspaces in their tenant simultaneously.
Read more
Object- Level Security (ODS) for Power BI Premium and Pro
Many QuickLaunch customers are currently leveraging row-level security (RLS), however, now there is a new security feature that allows you to secure data model objects at the table and column levels to protect sensitive information. This allows you to hide object names and metadata from the user so that they do not even know it exists.
Read more
(click to view larger)
Add and Edit Data Sources from the Power Platform Admin Center (Preview Feature)
If you are a Power BI Admin then you need to check out the Power Platform Admin Center. With the latest updates, you can now add new and edit existing cloud and on-premise data sources used by Power Platform programs like Power BI, Automate and PowerApps. This portal will eventually replace the Manage Gateways section of the Power BI Admin portal so it is a good idea to start familiarizing yourself with it soon.
Read more
(click to view larger)
[post_title] => Power BI Updates for QuickLaunch Customers: Q2 2021
[post_excerpt] => The Power BI team has been releasing new features in full force. Q2 has seen a steady stream of updates to all areas of the platform.
[post_status] => publish
[comment_status] => closed
[ping_status] => open
[post_password] =>
[post_name] => power-bi-updates-q2-2021
[to_ping] =>
[pinged] =>
[post_modified] => 2023-05-22 16:40:17
[post_modified_gmt] => 2023-05-22 23:40:17
[post_content_filtered] =>
[post_parent] => 0
[guid] => https://preferredstrategies.com/?p=9275
[menu_order] => 0
[post_type] => post
[post_mime_type] =>
[comment_count] => 0
[filter] => raw
)
[comment_count] => 0
[current_comment] => -1
[found_posts] => 112
[max_num_pages] => 13
[max_num_comment_pages] => 0
[is_single] =>
[is_preview] =>
[is_page] =>
[is_archive] =>
[is_date] =>
[is_year] =>
[is_month] =>
[is_day] =>
[is_time] =>
[is_author] =>
[is_category] =>
[is_tag] =>
[is_tax] =>
[is_search] =>
[is_feed] =>
[is_comment_feed] =>
[is_trackback] =>
[is_home] => 1
[is_privacy_policy] =>
[is_404] =>
[is_embed] =>
[is_paged] => 1
[is_admin] =>
[is_attachment] =>
[is_singular] =>
[is_robots] =>
[is_favicon] =>
[is_posts_page] =>
[is_post_type_archive] =>
[query_vars_hash:WP_Query:private] => 541afdbd0092fc8556628d6857b4cbe4
[query_vars_changed:WP_Query:private] =>
[thumbnails_cached] =>
[allow_query_attachment_by_filename:protected] =>
[stopwords:WP_Query:private] =>
[compat_fields:WP_Query:private] => Array
(
[0] => query_vars_hash
[1] => query_vars_changed
)
[compat_methods:WP_Query:private] => Array
(
[0] => init_query_flags
[1] => parse_tax_query
)
)
In the News
Trends in ERP Adoption in Construction
Ben Harrison, vice president of product management at Preferred Strategies, discusses trends in the adoption of Enterprise Resource Planning (ERP) in the construction industry and how QuickLaunch can help contractors better utilize ERP data to its full potential.
Blog
Power BI Updates for QuickLaunch Customers: Q1 2021
March 23, 2021
Power BI was named a leader in the Gartner magic quadrant again this year. (Be sure to check out our interactive analysis of the Magic quadrant here.) A major factor of Power BI’s success has been the dedication by Microsoft to continuously improve the Power BI product suite with updates that are demand-driven and consistent.
Case Study
How Power BI Changed Analytics at IGI Wax
In this Q&A session with Bill Sandblom, MIS Director at International Group, Inc. (IGI Wax), Bill shares IGI’s digital transformation journey and explains how the company experienced a three-year head start with QuickLaunch for Power BI.