Event Category: EDUCATIONAL SESSION
Power BI Office Hours — Overview of the Latest PBI Updates in 2023 – Part 1
The Power BI team constantly rolls out new features and enhancements to the Power BI platform including updates to the Power BI Desktop, the Power BI Service, and the Power BI Mobile App. In this education session, we will comb through all the latest updates to Power BI (and related Microsoft Data Analytics technologies) and present the ones that we think are most relevant based on the underlying architectures, processes, and strategies common to most enterprise analytics deployments.
Automate Your ERP Reporting Workflows: Unlocking the Power of Modern Analytics with Power BI
Are the ERP reporting tools you are using enabling your company to make timely business decisions with confidence? Running time-consuming ERP reports or query tools, exporting the results to Excel, and spending hours manipulating hard to manage spreadsheets every week or month is a recipe for failure.
If this sounds familiar, attend this session to understand how Microsoft Power BI, the world’s most widely used data analytics system, combined with a solid data management platform can automate the traditional error-prone process outlined above to save employee’s time, breakdown data silos, and get more value from your organization’s data.
This demo-filled presentation will showcase the process of the future that leverages an up-to-date, easily governed, and centralized cloud-based solution.
In this session you will learn:
o The challenges and pain points of traditional ERP report development methods
o How to automate the data gathering, transformation, and modeling process using the latest cloud based technologies and a centralized approach that saves resources and delivers confidence in analytics
o Learn how Power BI can empower business users with an innovative and intuitive tools
o How to automate the distribution of insights to your entire organization with an easily governed approach
Mastering Power BI Fundamentals: How to Build Interactive Financial Reports for JD Edwards
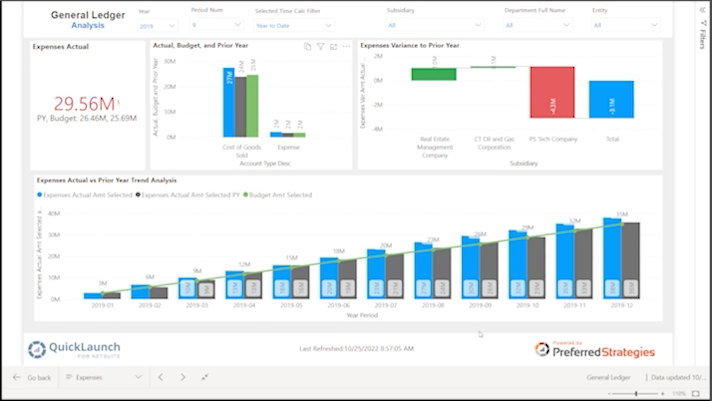
Join us for a free Education Session on How to Build Interactive General Ledger Reports for JD Edwards.
In this workshop you will learn how to:
• Connect to ERP data for financial reporting and analytics
• Create interactive data visualizations in the Power BI Service
• Effectively compare actuals to comparative measures like budget and prior year
• Quickly distribute financial insights across your organization
• And key terminology and Power BI concepts, navigation, and report develop basics and best practices
Mastering Power BI Fundamentals: How to Build Interactive Sales Reports for JD Edwards
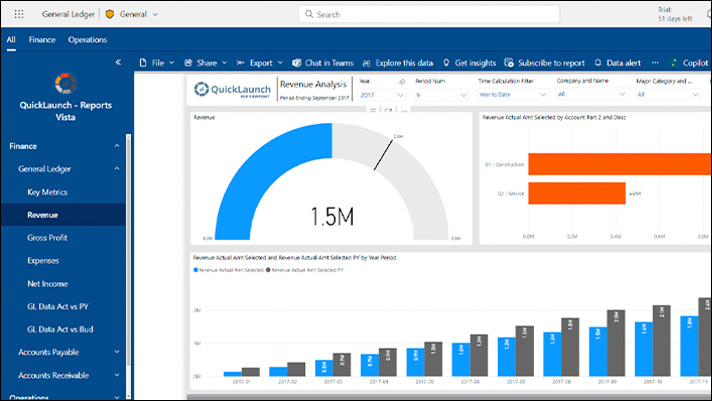
Join us for a free Education Session on How to Build Interactive Sales Reports for JD Edwards.
In this workshop you will learn how to:
• Connect to JDE ERP data for sales reporting and analytics
• Create interactive data visualizations in the Power BI
• Effectively compare actuals to comparative measures like forecast and prior year to actively monitor performance
• Quickly distribute customer and sales insights across your organization
• And key terminology and Power BI concepts, navigation, and report development basics and best practices
Creating & Optimizing Calculation Groups
See how Preferred Strategies is using Cube Value functions in QuickLaunch 5.x to simplify time based calculations. Learn how and why you may want to create new calculation groups as well as some of the important things to consider when using developing new ones. This information is important for those that are responsible for adding new measures to the QuickLaunch model and even for those building Power BI reports so you can understand how new features like calculation groups can be used to expand the time based measures that are available.
Transform IT into a Strategic Business Advantage Using Your JDE Data
To be successful and competitive in today’s landscape, organizations need to easily access, consume, and digest corporate wide data and information, and IT leaders are expected to deploy programs that ultimately deliver revenue growth, positive business outcomes, profitability, and innovation that result in corporate growth. In this educational session you will experience how simple it is to turn your JDE investment into one of your most valuable business assets.
Transform IT into a Strategic Business Advantage Using Your Viewpoint Vista Data
To be successful and competitive in today’s landscape, organizations need to easily access, consume, and digest corporate wide data and information, and IT leaders are expected to deploy programs that ultimately deliver revenue growth, positive business outcomes, profitability, and innovation that result in corporate growth. In this educational session you will experience how simple it is to turn your Viewpoint Vista investment into one of your most valuable business assets.