As we move towards the holiday season, let’s review what the Power BI team has been up to over the summer and early fall of 2021. There have been some interesting features introduced across all three of our Power BI user categories including automated insights for consumers that leverage the latest in AI and Machine learning, DirectQuery for PBI Datasets and AAS that lets authors customize enterprise data models, and updates to Sensitivity labels which helps Admins better protect assets in Power BI.
Power BI Consumers
Automated Insights Feature (Preview Feature) (Premium Feature)
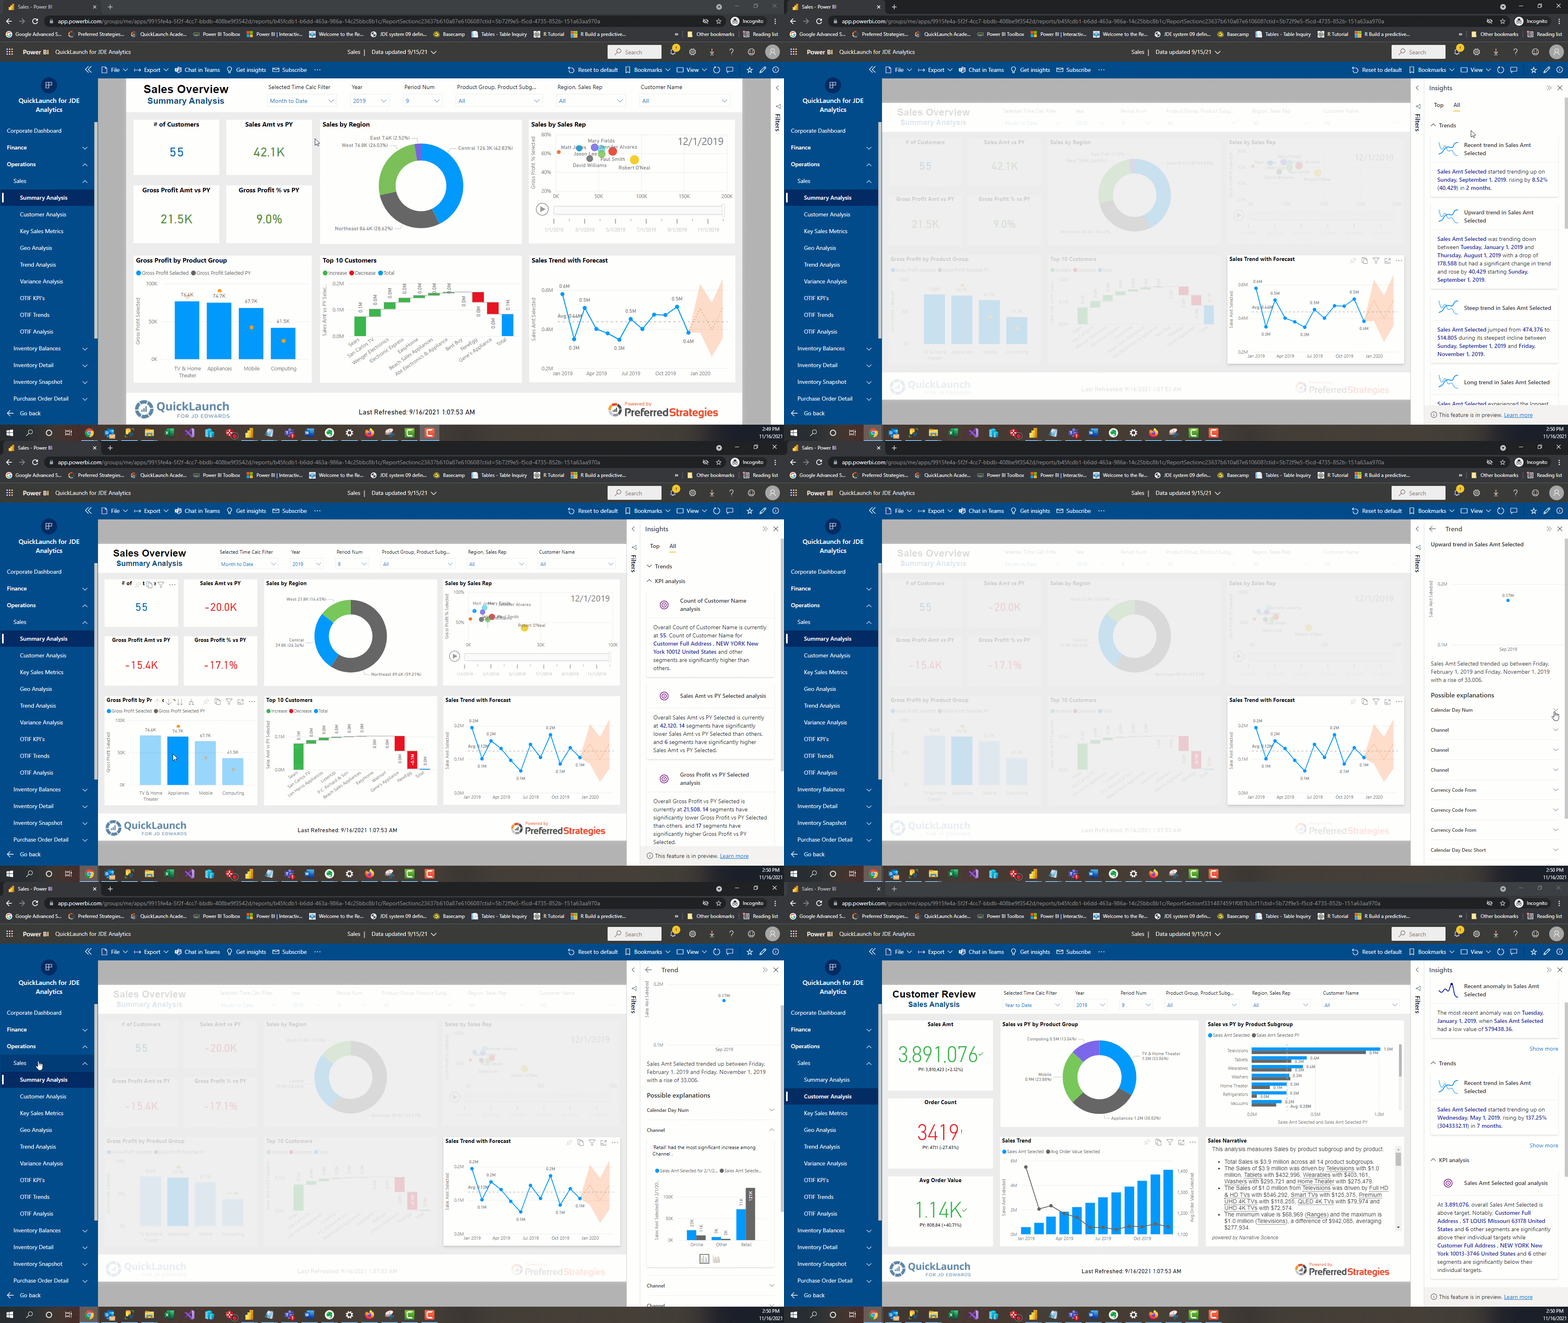
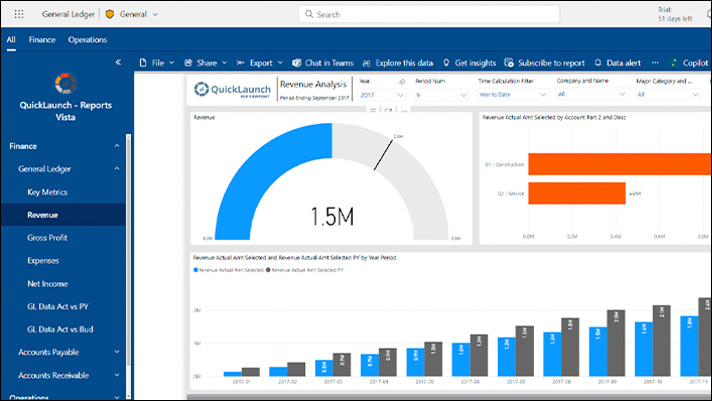
Leverage the latest automated machine learning feature built into the Power BI consumer experience to easily find and explore insights such as trends, outliers, and KPI analysis with the click of a button inside a report. The Insights feature is context aware so that as you change filters and pages in your report, new insights will be generated. This is an exciting development as reports that were in “Live Connection” previously didn’t not work with many of the latest AI Power BI features.
Analyze Teams Usages with Power BI Teams App
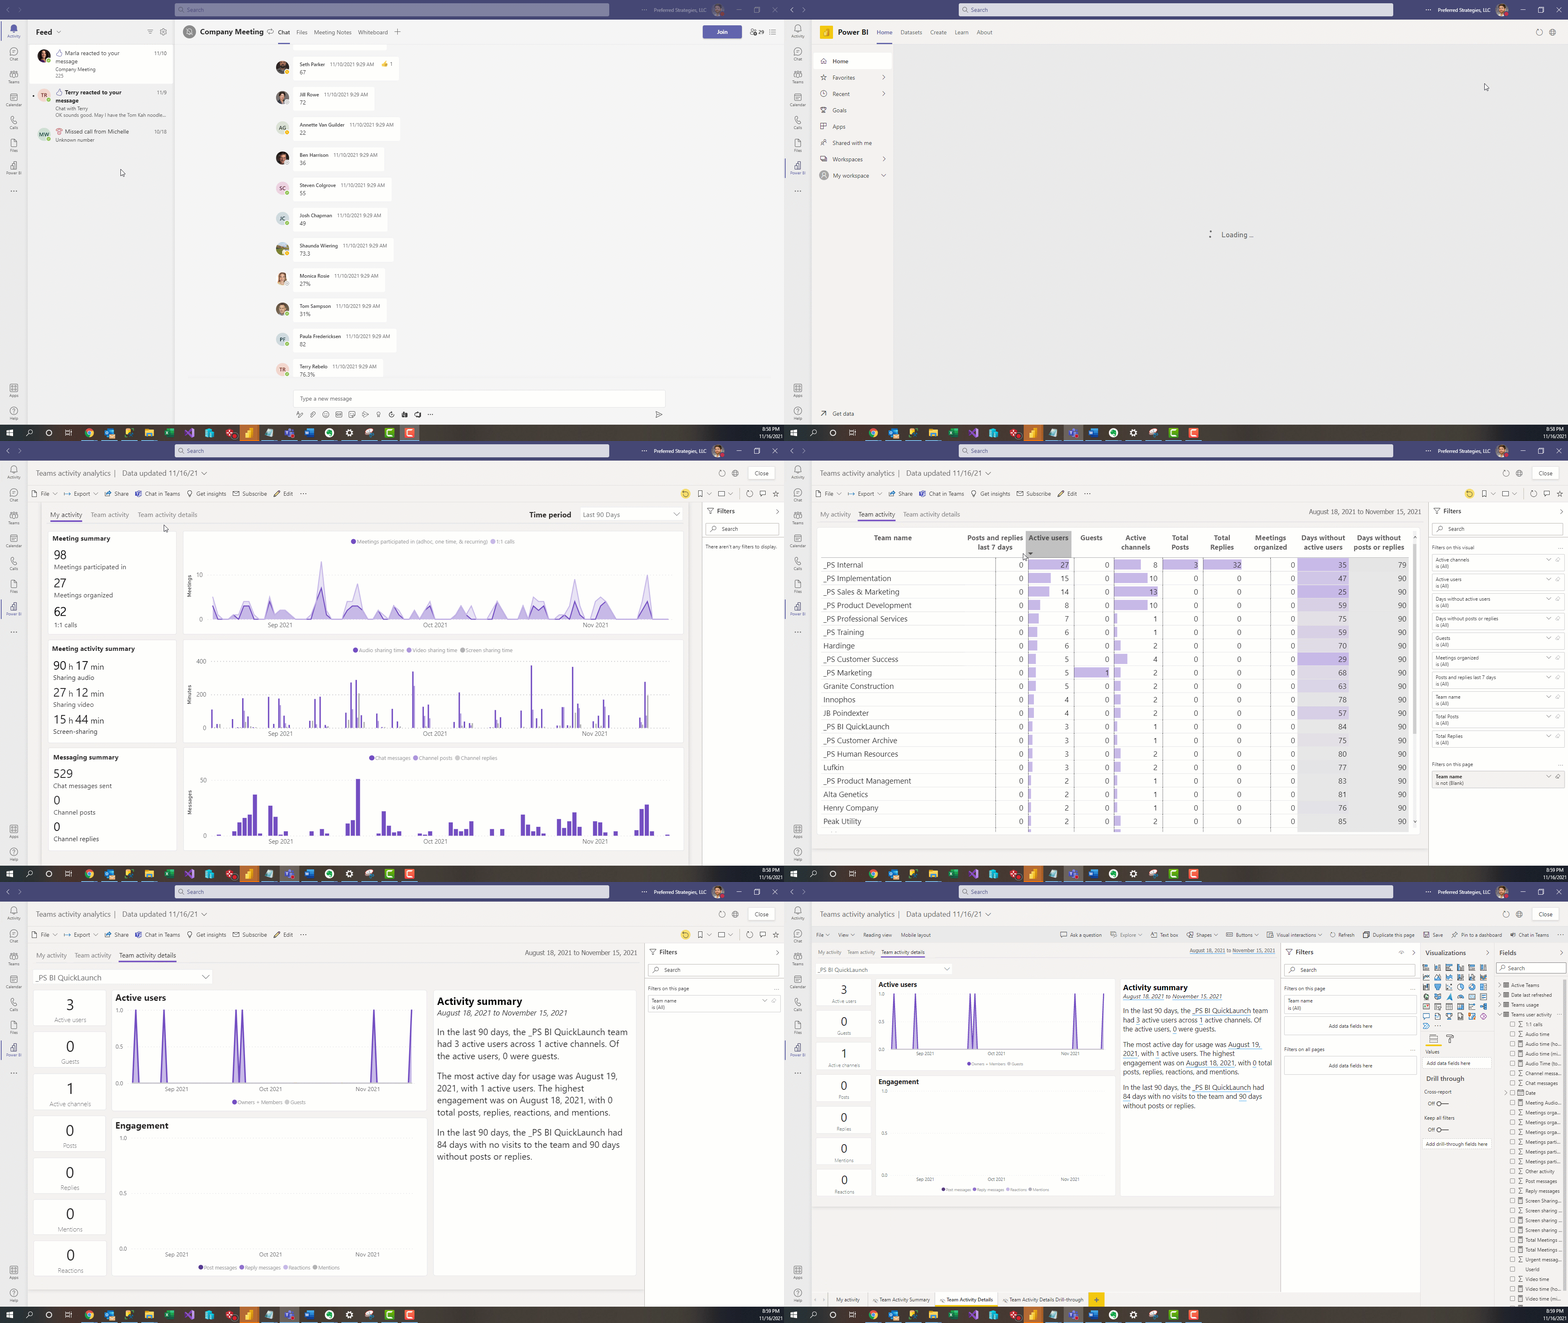
If you are one of the millions of professionals that has adopted Microsoft’s collaboration app over the past couple of years then this update may interest you. From the Power BI app in Teams, you can easily analyze Teams usage data. The auto generated report includes a My Activity page that shows your personal usage information, a Team activity page allows you to compare general metrics across all the teams you’re a part of, and the Team activity details.

Power BI Designers
Direct Query for Azure Analysis Services and Power BI Datasets (Preview Feature)
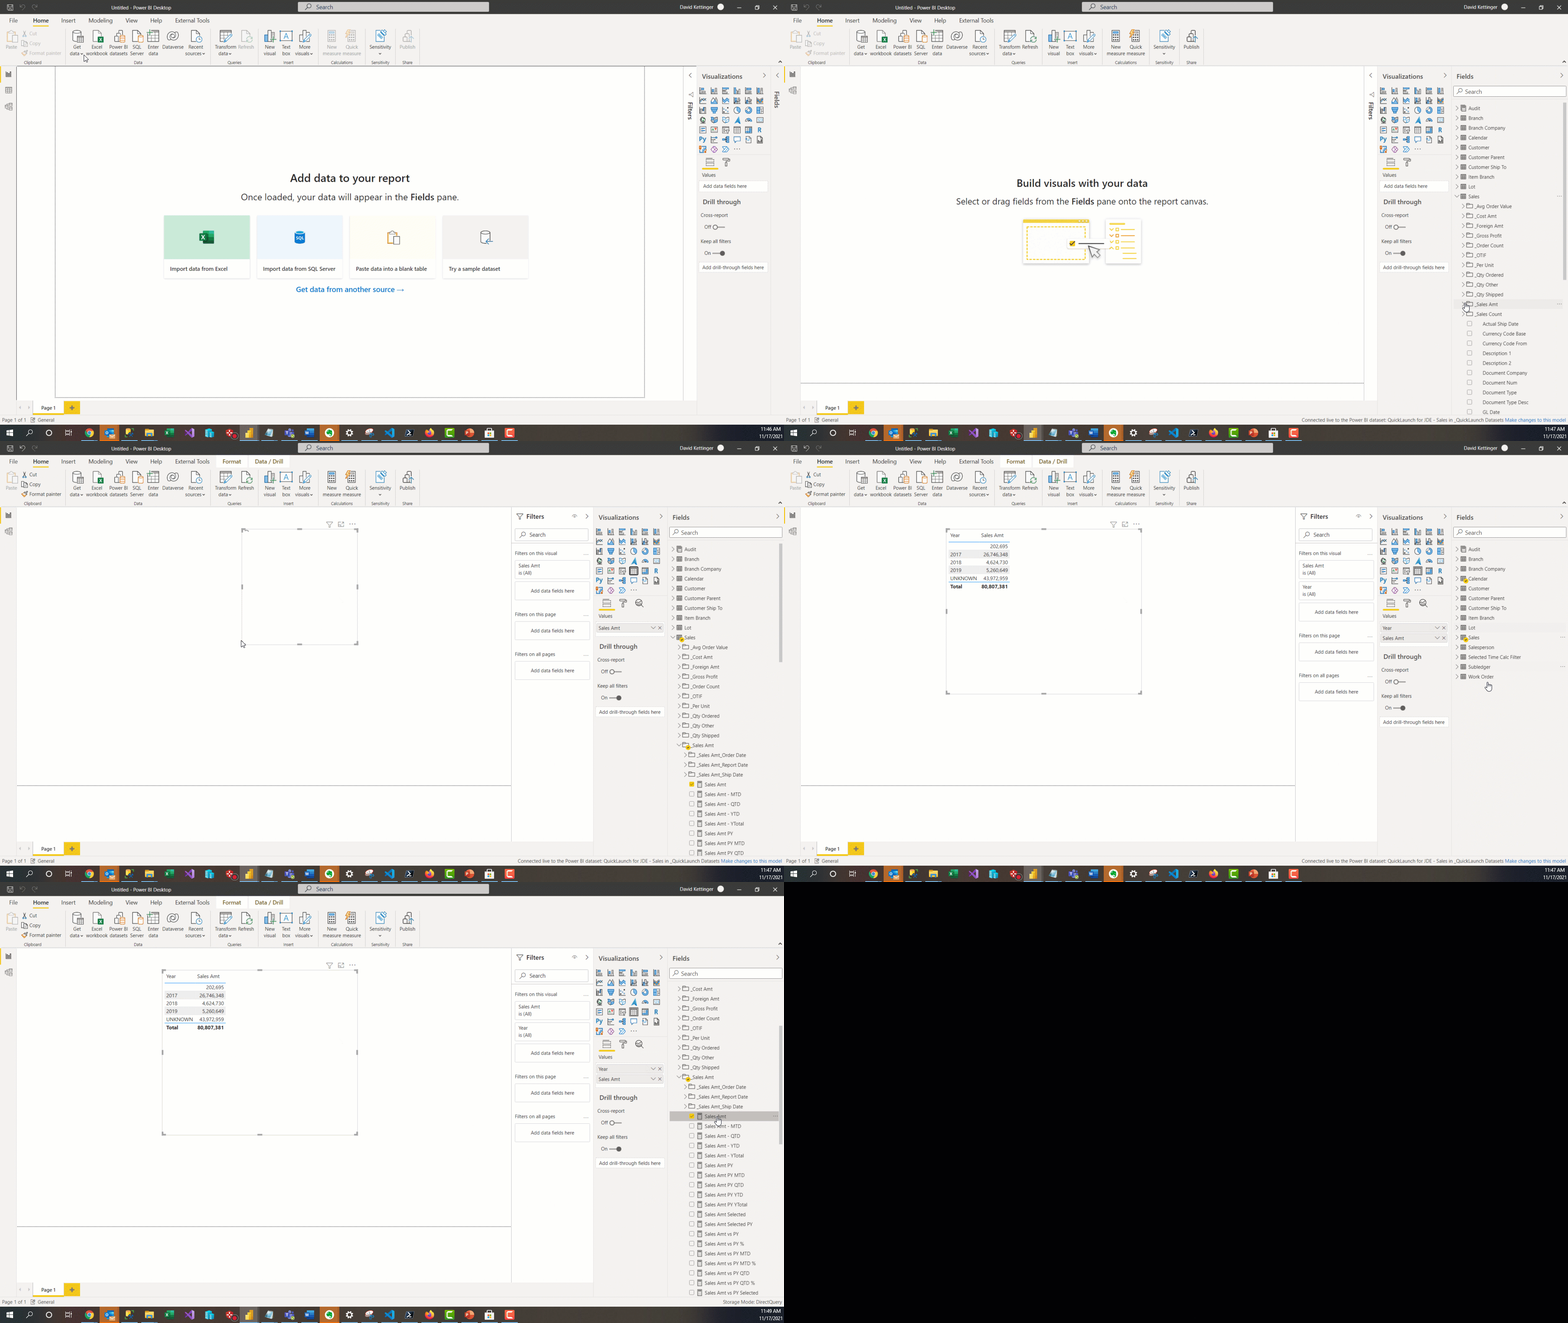
With this feature, power users and report authors create a local model that connects to existing Azure Analysis Services data models and Power BI Datasets and bring in data from other data sources such Excel workbooks and SaaS providers. It also provides the ability for users to personalize or enrich the metadata from existing enterprise semantic models such as changing the formatting of fields and adding new calculated columns. This can be a great tool for prototyping new data model designs or for one off reports that require custom data modeling.
Read more
(click to view larger)
New Buttons
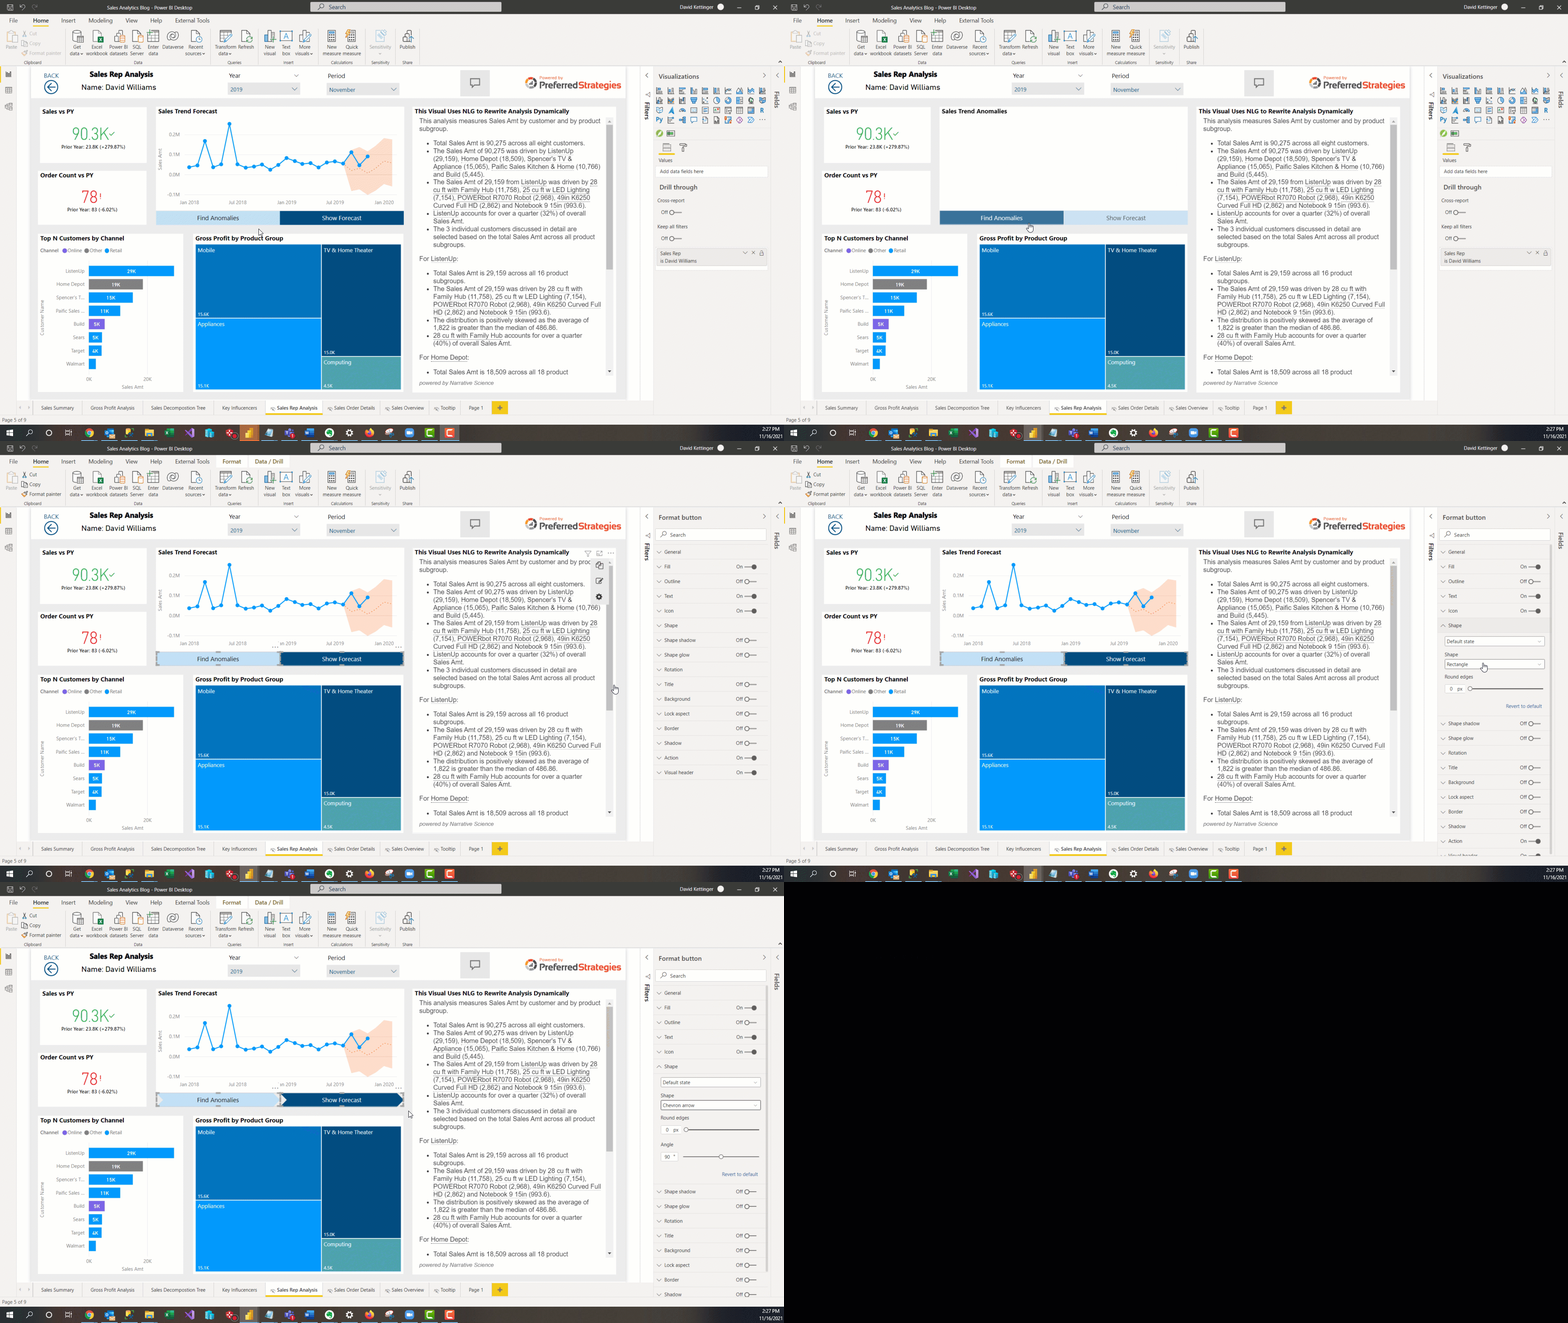
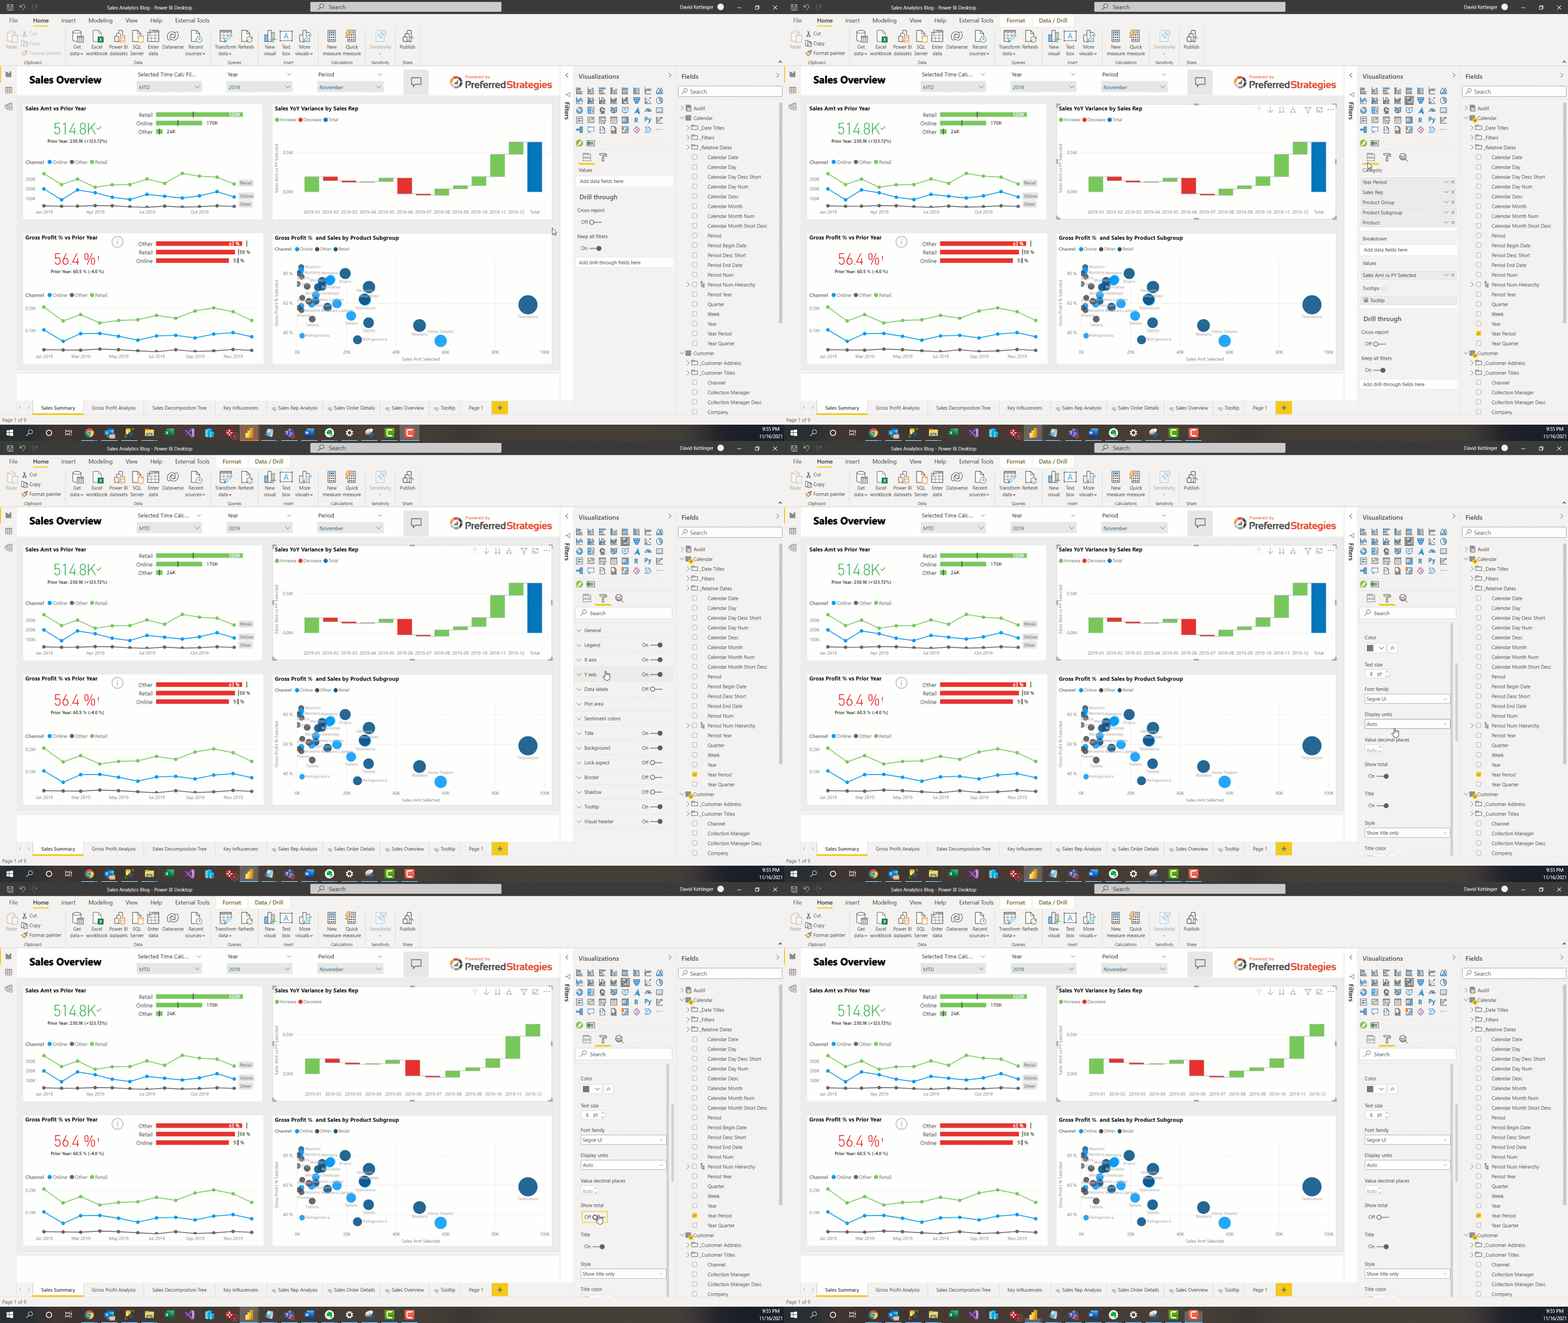
In the past, if you used buttons in your reports, the formatting options were limited. You were required to use a rectangle shape and customization usually required overlapping visuals. However, with the latest updates to button objects in Power BI, you can now choose between many new shapes, use custom icons, and more.
Assign Line Chart Series Labels
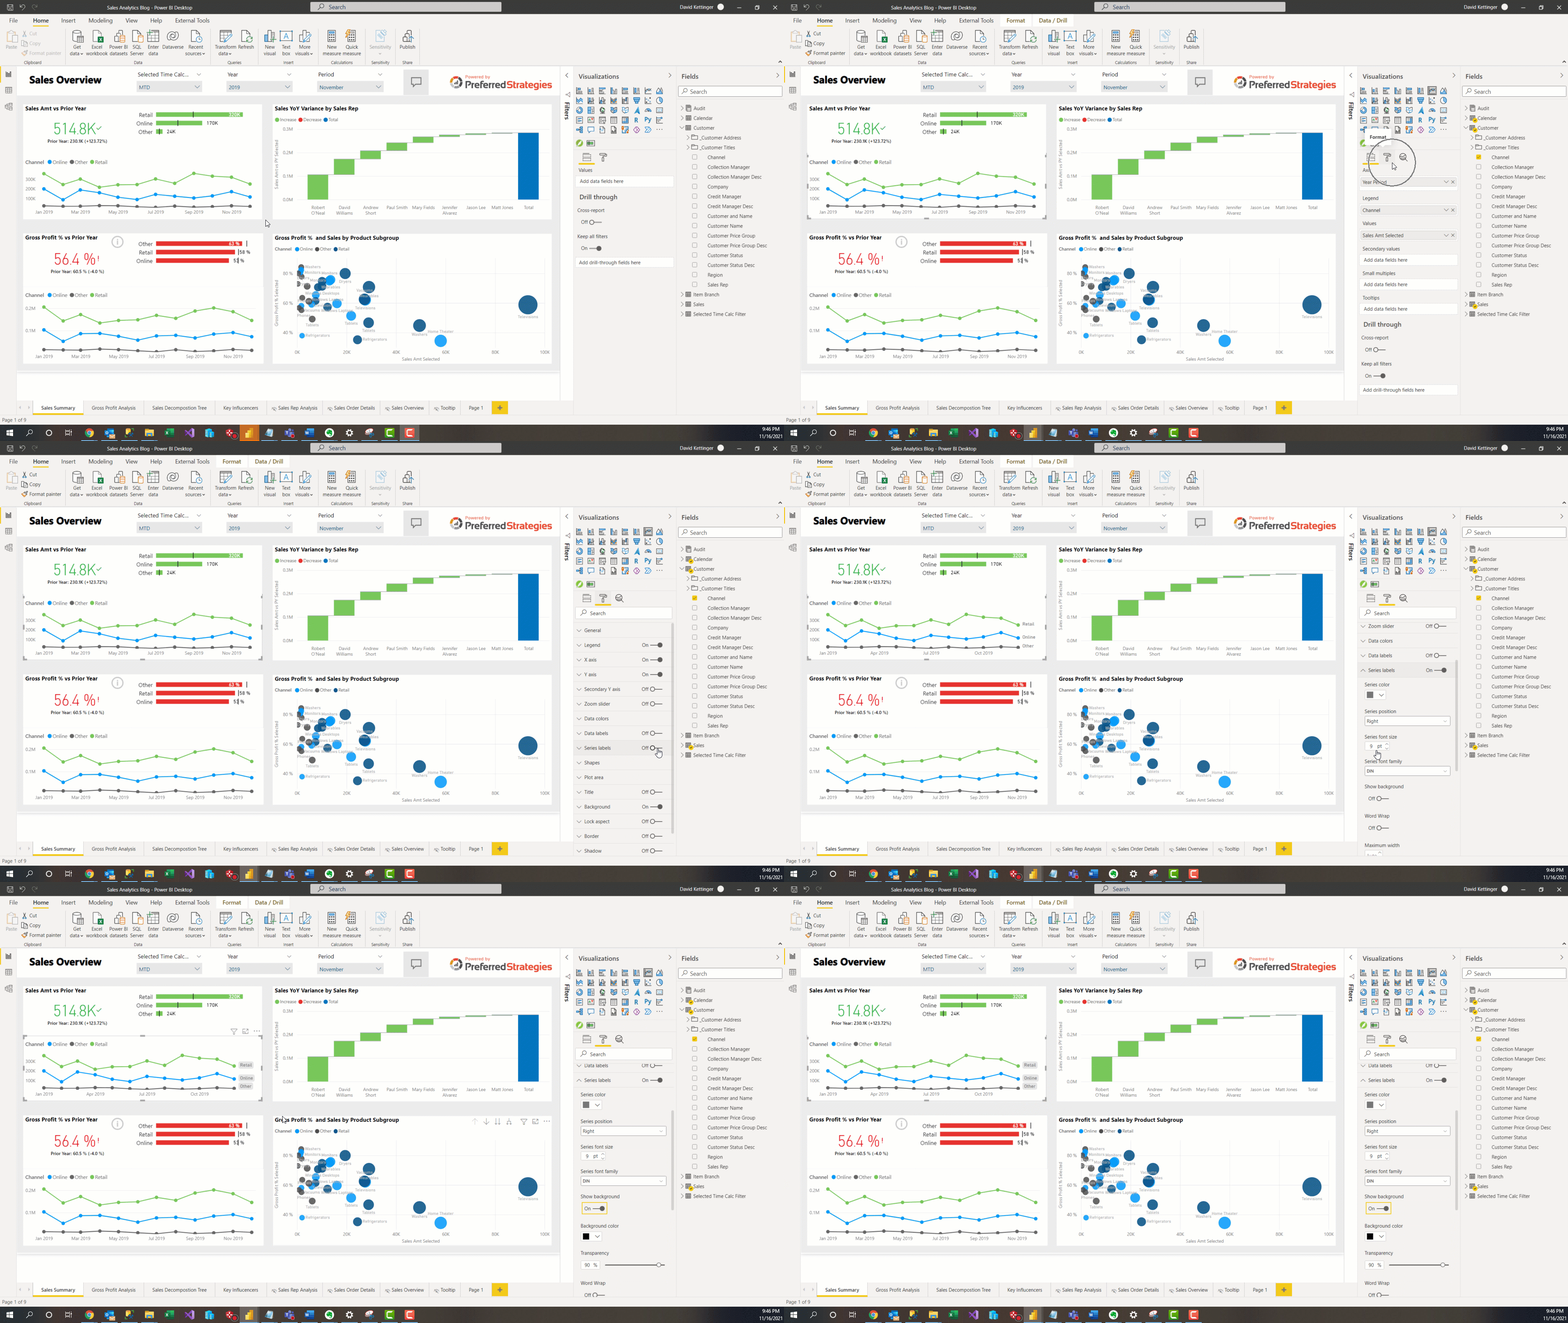
Sometimes a legend is always enough and to further aid consumers of a report, it is helpful to be able to assign labels to elements in your visualizations. With this new enhancement, you are now able to provide more clarity on which lines are associated with categories using the new series labels formation option.
Turn Off Total Column in Waterfalls Charts
Waterfall charts are great visualization to have in your toolbelt and with this update, you can now customize the visualization further by being able to control whether a total column is displayed or not. By default, this will be enabled to show what the total was across all the elements in the series, however you can turn if off under the formatting pane for the visual.

Power BI Admins & Content Managers
Bulk Upgrade Classic Workspaces to V2 Workspaces
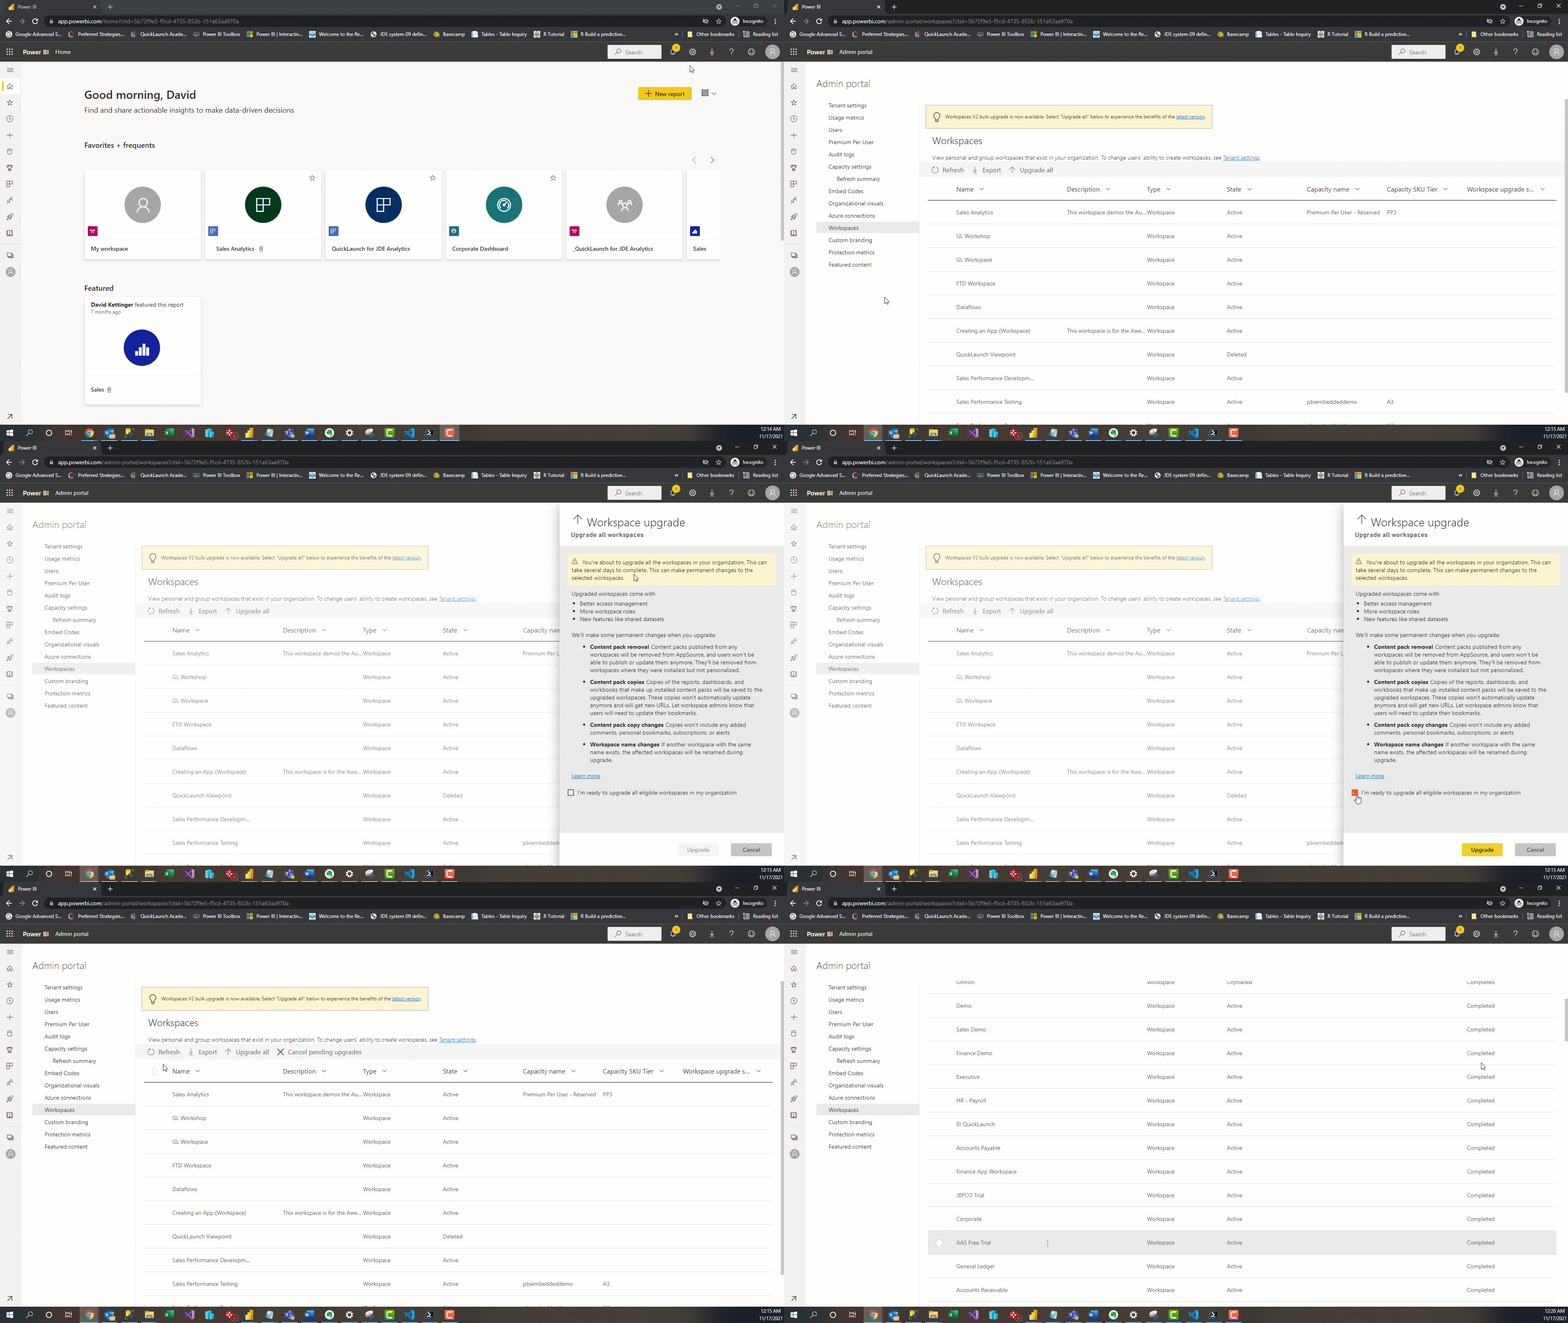
The Power BI team has created a bulk-upgrade tool within the Workspaces section of the Power BI Service Admin portal that allows admins to automatically update all the classic workspaces in their tenant to the latest V2 version. The new workspace is required to get the latest features and security enhancements in Power BI.
Microsoft Information Protection (MIP) and Sensitivity Labels
MIP helps organizations classify and protect information as it moves inside and outside of the organization and across devices, apps, and services to prevent data loss. One of the main MIP tools to accomplish this is creating sensitivity labels and label policies that can be inherited across different data sources and file types. Once you create different sensitivity categories, you can enforce protection settings based on that classification such as encryption and content markings. In Power BI, you can assign Sensitivity labels to corporate data sources such as Azure SQL DB, Power BI Datasets and reports, and files such as Excel workbooks.
Power BI Desktop Required Infrastructure Change
Microsoft is changing the components used by the Power BI Desktop application. Starting in Feb 2022, Power BI Desktop will move away from CerSharp to WebView2. To avoid interruptions, ensure that users that use PBI Desktop have ‘Microsoft Edge WebView2 Runtime’ installed on your machines.
We are excited about what the Power BI team is releasing soon! If you’re interested in checking out the Power BI feature release plan in an interactive Power BI report click here.


