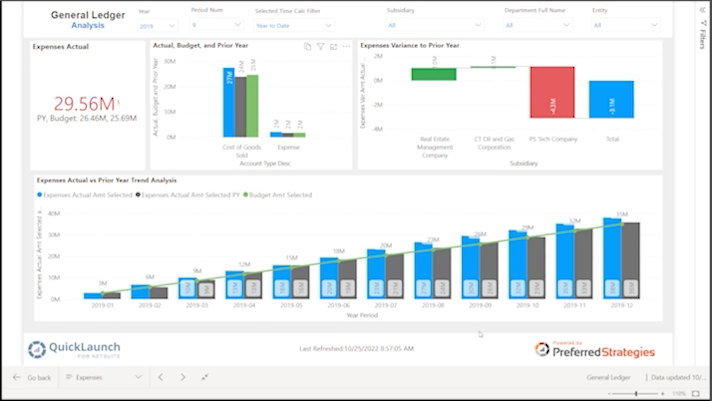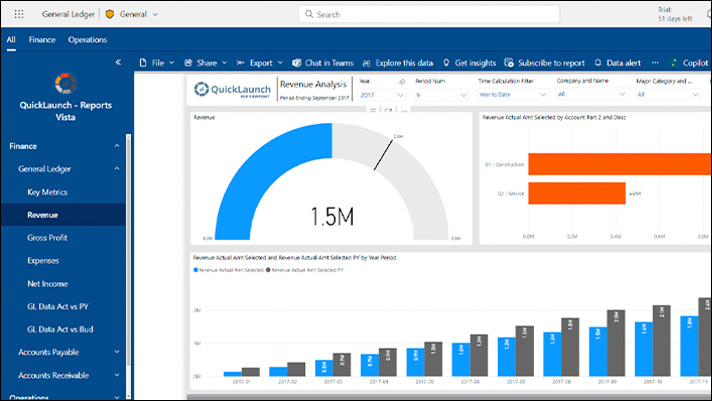
The Power BI team constantly rolls out new features and enhancements to the Power BI platform including updates to the Power BI Desktop, the Power BI Service, and the Power BI Mobile App. While it is awesome that Microsoft is committed to this continuous delivery strategy to quickly push updates into production, sometimes it can feel like drinking out of a firehose when trying to keep up with all the latest news. In this ongoing blog series, we will comb through all the updates to Power BI (and related Microsoft Data Analytics technologies) and present the ones that we think are most relevant to QuickLaunch customers based on the underlying architectures, processes, and strategies common to most QuickLaunch deployments.
Power BI usually releases new features first in the Preview phase so that they can test functionality and get feedback from the users. Once all the kinks are worked out, features are then made Generally Available which means they are production ready. At Preferred Strategies, we are often early adopters of these Preview features especially if the value added is significant compared to the risk. We will indicate which features are in Preview so that you can take that into account when thinking about implementing an update in your organization.
Power BI Premium is a subscription service from Microsoft that gives companies access to more enterprise features than what is offered through the standard Power BI Pro offering. Since some of our customers do not have a footprint in PBI Premium, we will specify which features are only available for Premium customers.
The updates will be categorized into three main parts which include:
- Power BI Consumers – Users that mainly interact with Power BI to consume insights
- Power BI Designers – People who are actively developing reports, dashboards, and data models
- Power BI Admins and Content Managers – Users who administer Power BI settings and maintain content in the Power BI Service
For the first installment of this blog series, we will cover the top updates from 2020 in three separate articles corresponding to the categories listed above. However, future posts will cover the updates within the last month. And without further adieu, let’s jump into it!
Power BI Consumers
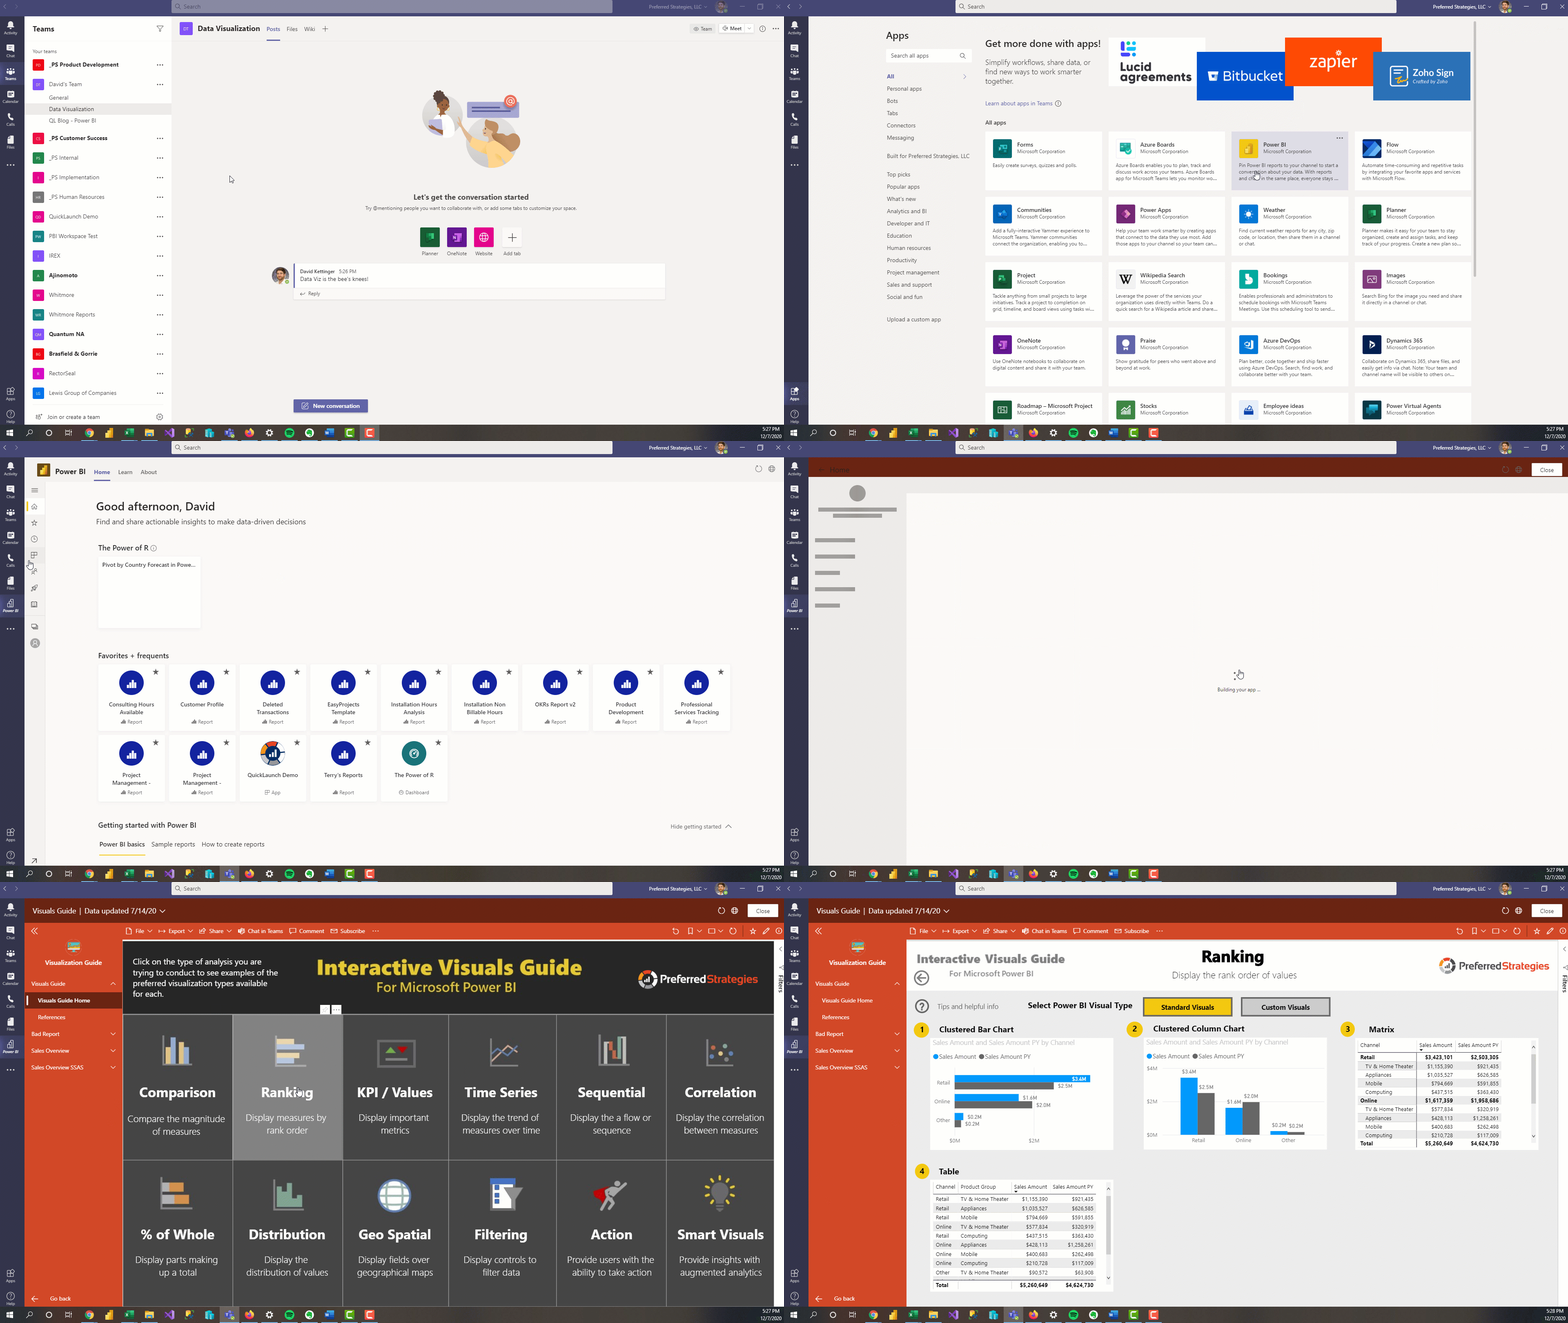
Power BI App in Teams (Preview)
With the new Power BI App in teams, consumers can view and discuss PBI content from the same place. This new integration essentially allows users to have the full Power BI experience within Teams so they no longer need to use a browser to reach the PBI service. Microsoft has been pretty good at integrating Power BI with other O365 applications such as Excel and PowerPoint so it is exciting to see them incorporate PBI into Teams so that data can be closer to the dialogue and decision making within organizations.
New User Interface for PBI Service
Power BI updated the UI for the PBI Service, making it cleaner and more user friendly. These updates have been in Preview for over a year but are now generally available as of November 2020. While in preview, users had to use the New Look On/Off toggle switch in the top ribbon of the PBI Service to control what UI they were shown but now the new look is automatically enabled for everyone.
Personalize Visuals
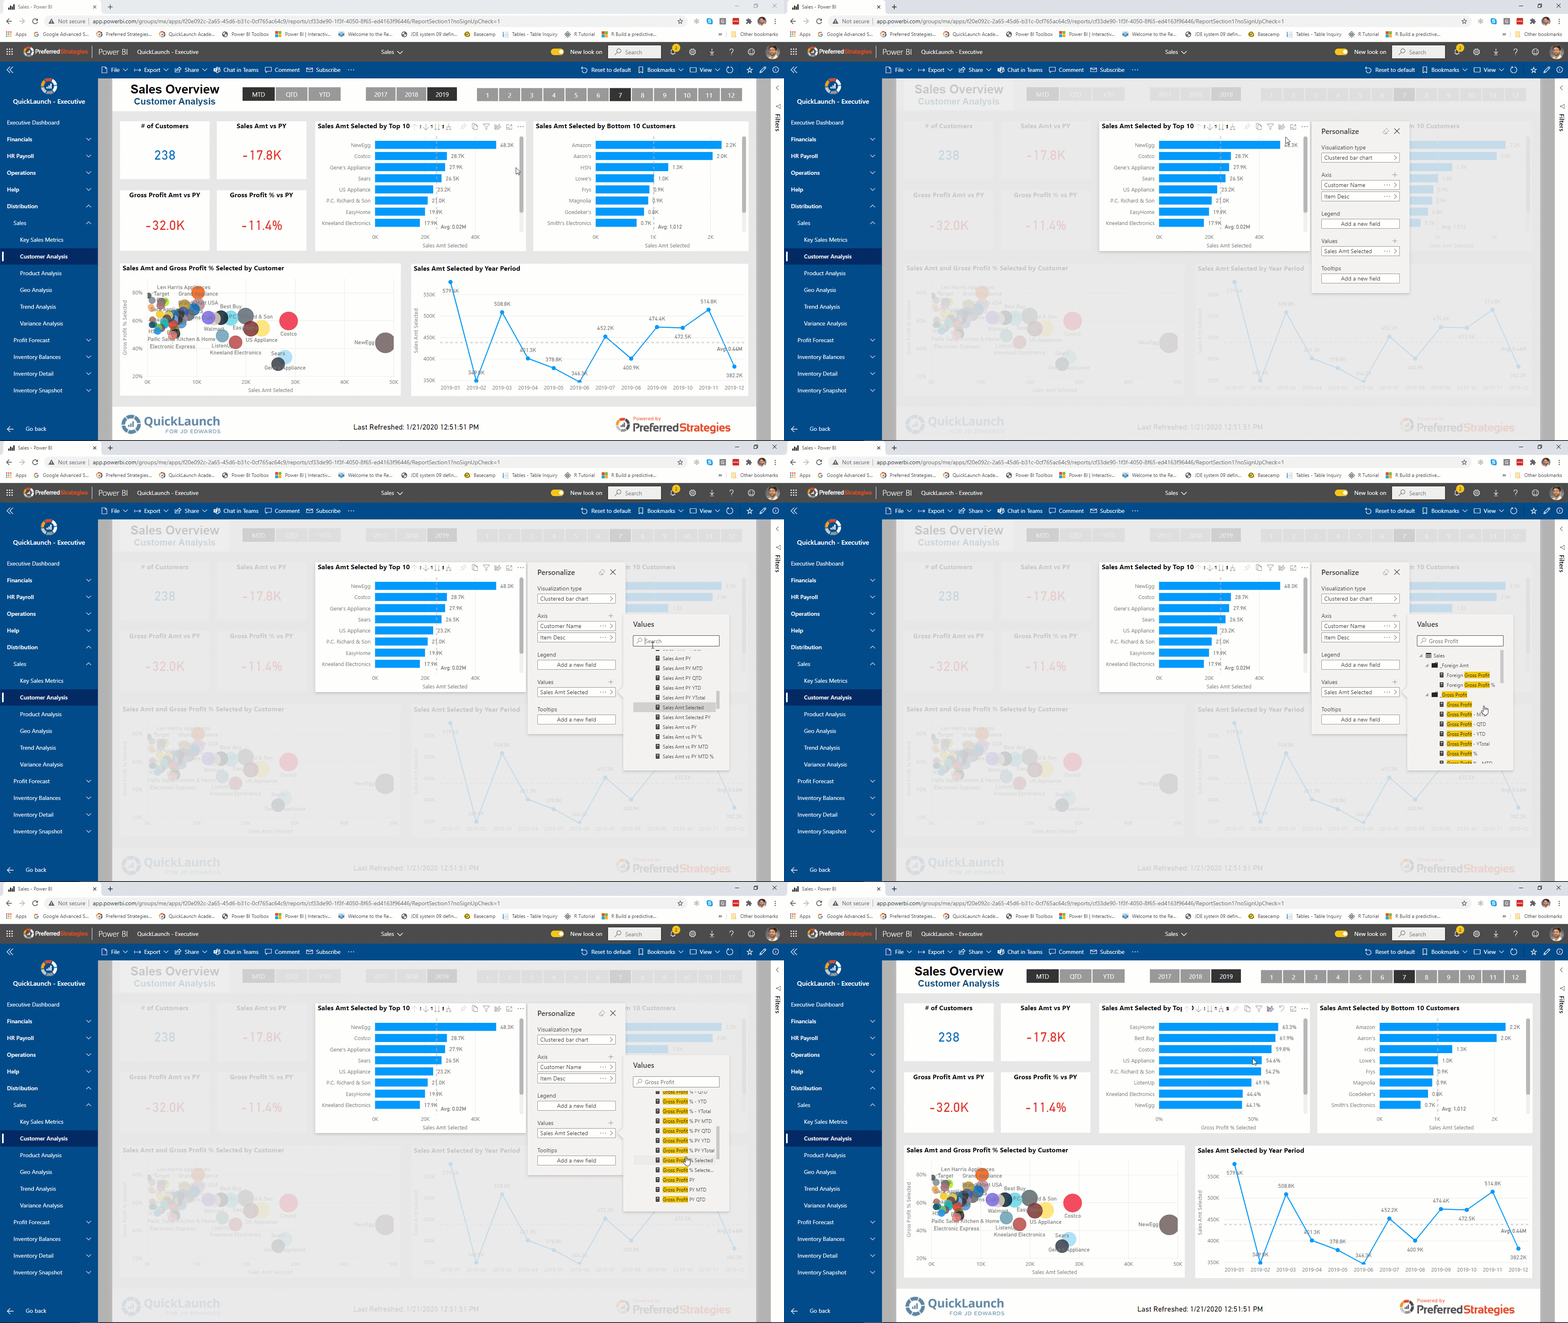
It is hard to make one version of a report that will satisfy every user in an organization. The Personalize Visuals feature allows consumers to make changes to the visualizations in a report while in reading view. This includes changing the visualization type, adding a legend, and changing the fields used within the visual. After making these updates, users can save them as a Personalized Bookmark so they can come back to them later without having to modify the existing report.
Apply All Filters
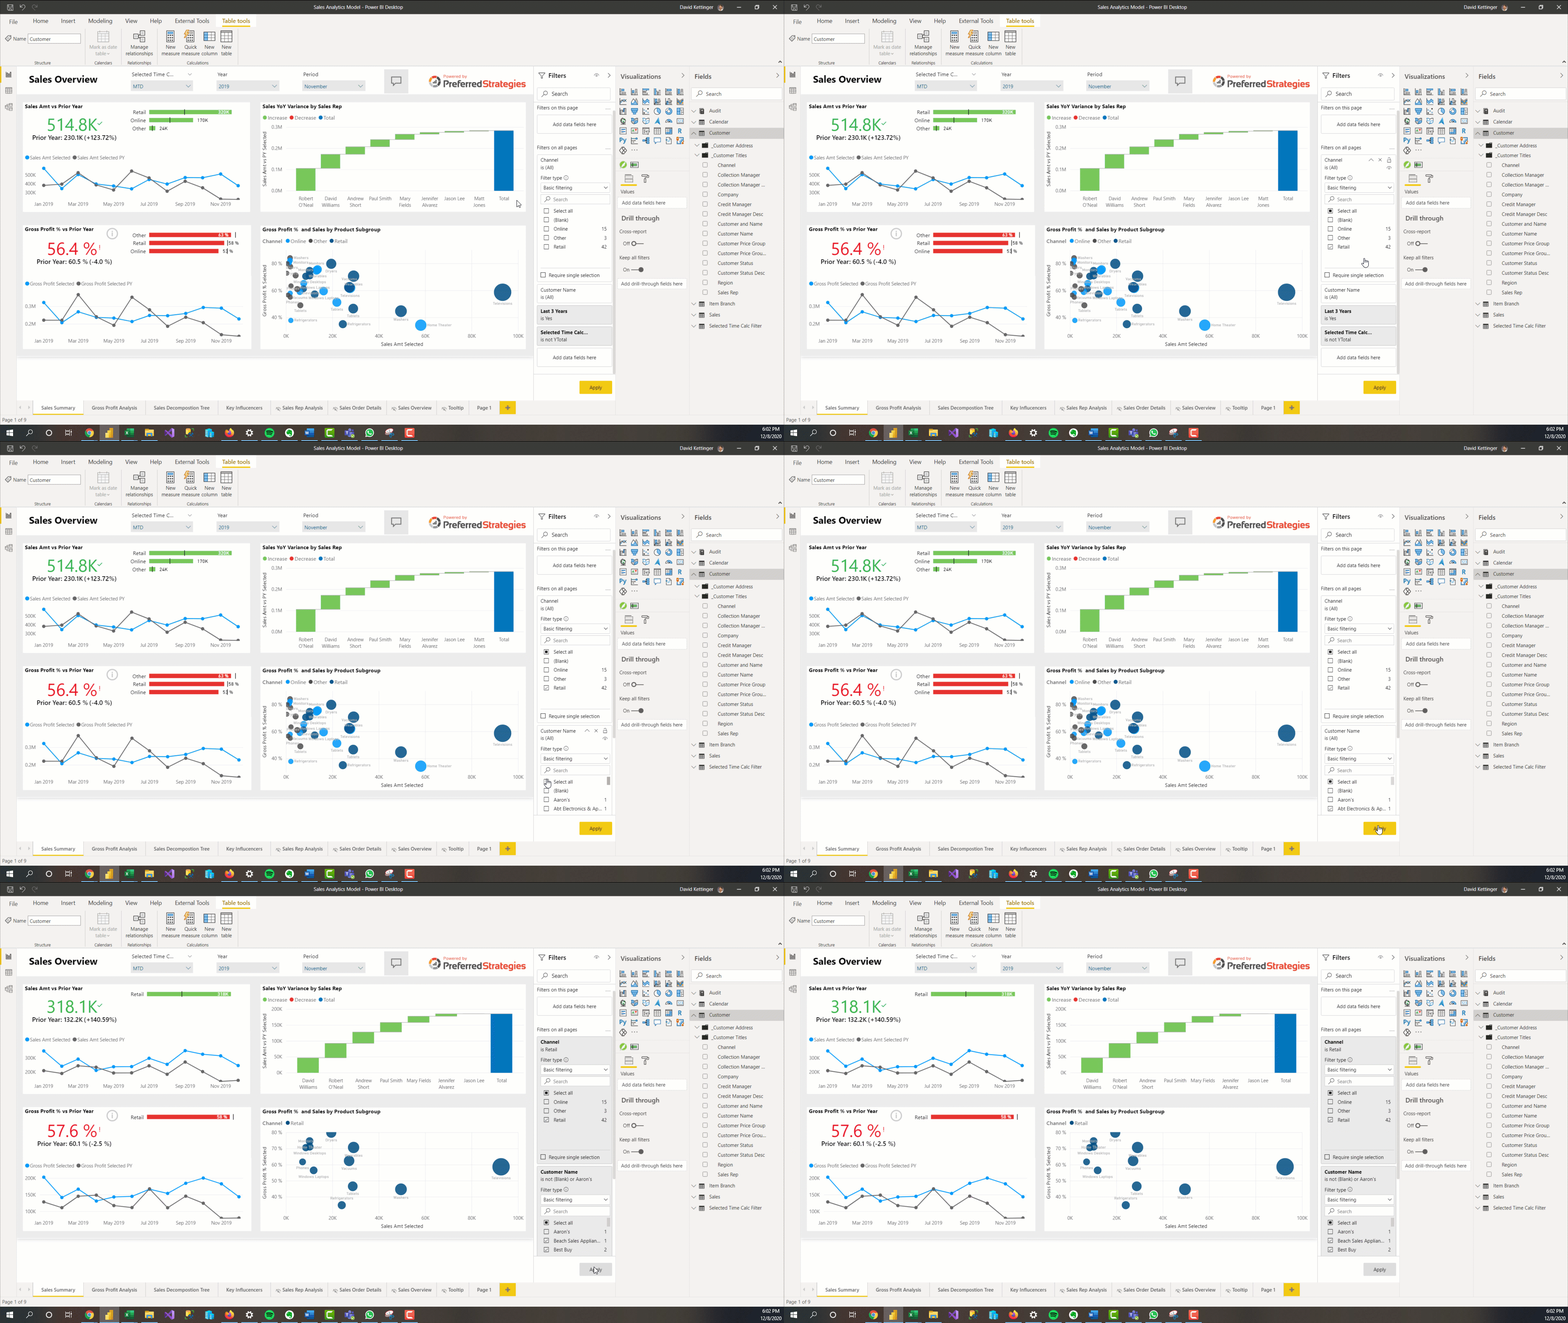
By default in Power BI, when you change a filter value in the filter pane it simultaneously applies the updates to the report. In Live Connection mode to Analysis Services Tabular models and Power BI Datasets, this means that every time you change a slicer or filter, the report will send out new queries to the database and the visuals on the report will have to render again. In order to reduce the number or queries sent to the database and potentially the load time for consumers, there is a new feature that allows you to update all your filter values and then apply the changes all at the same time. This Apply All Filters features needs to be enabled in the report settings so ask your report designer to enable this functionality if you are interested in this.
Rectangle Select (Preview)
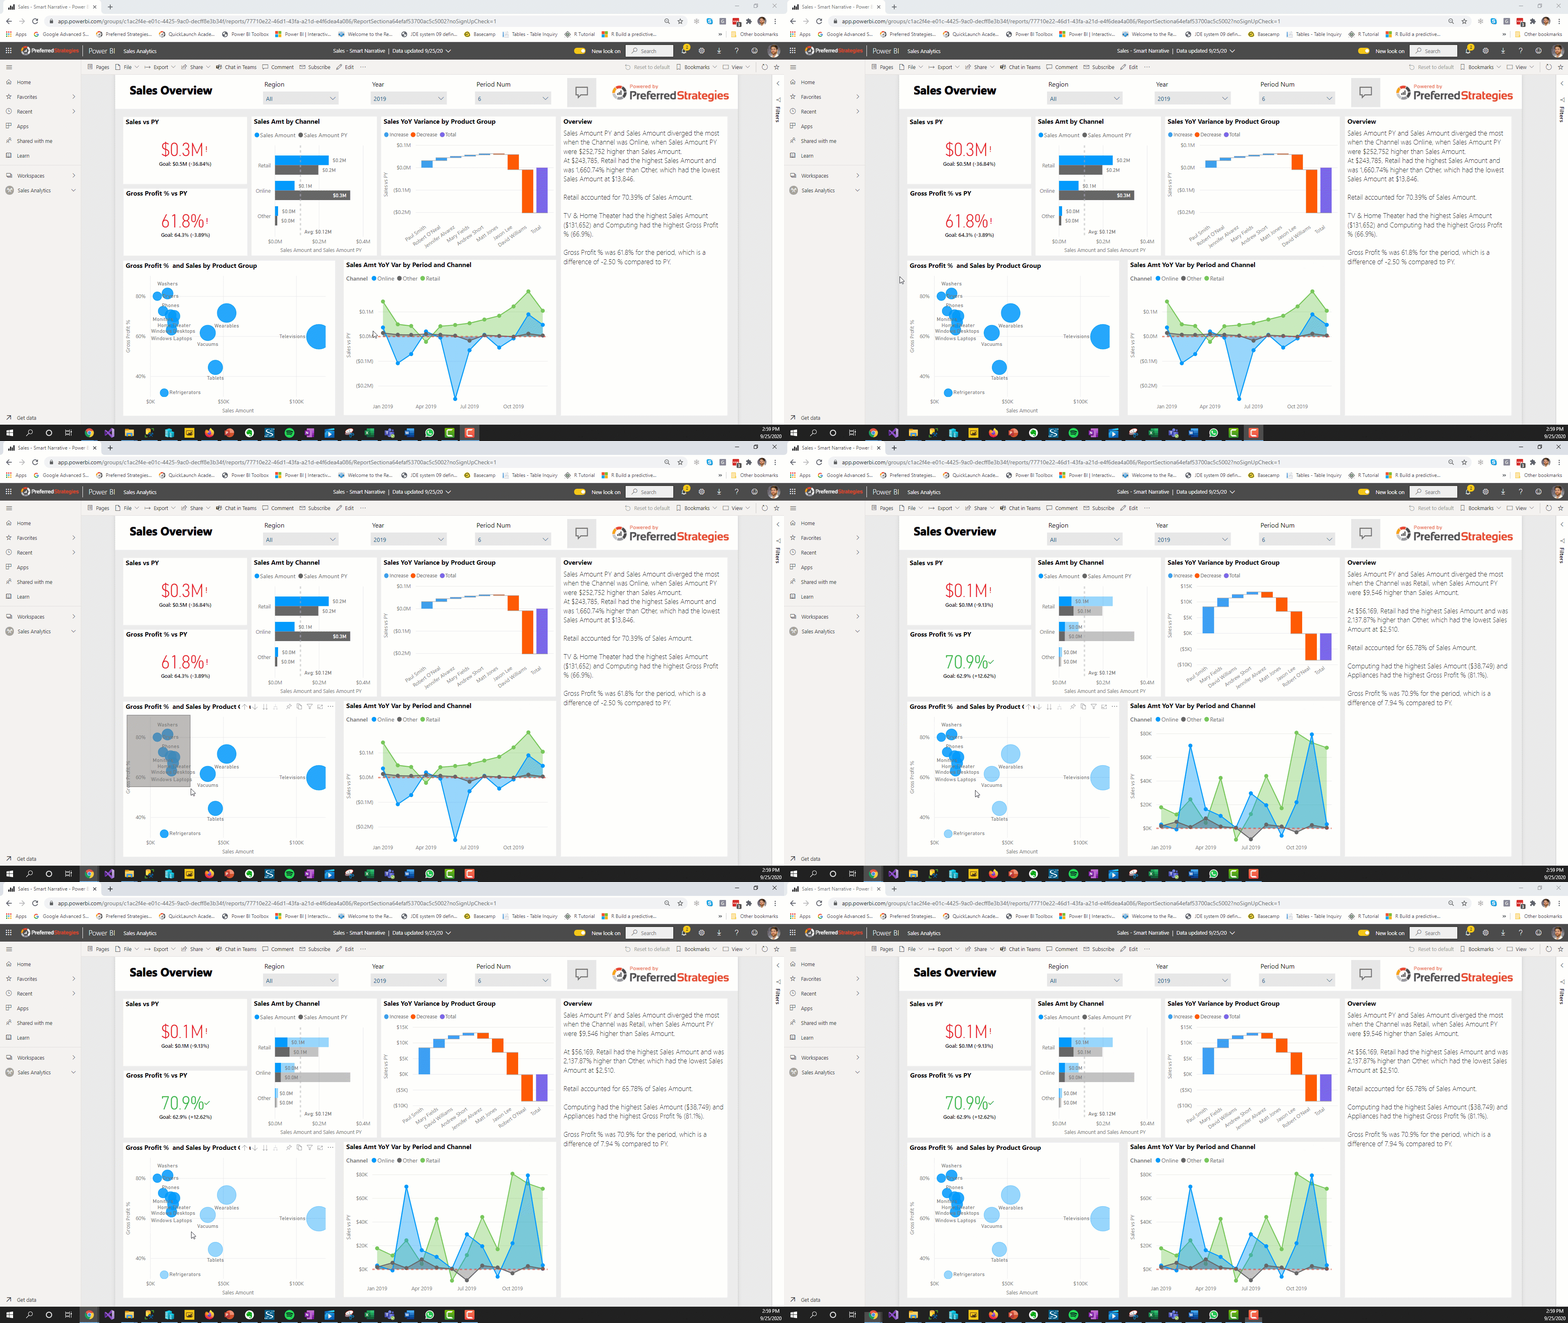
Otherwise known as Lasso select in other applications, this functionality allows you to select multiple data points simultaneously by drawing a rectangle around the data points. It is supported for map, line, area, combo, stacked bar/column, clustered bar/column, 100% stacked bar/column, and clustered line and column charts. Use it to quickly analyze segments or clusters within your data.
Stay tuned for Part 2 of this blog installment which will cover updates for users that are designing Power BI reports.


