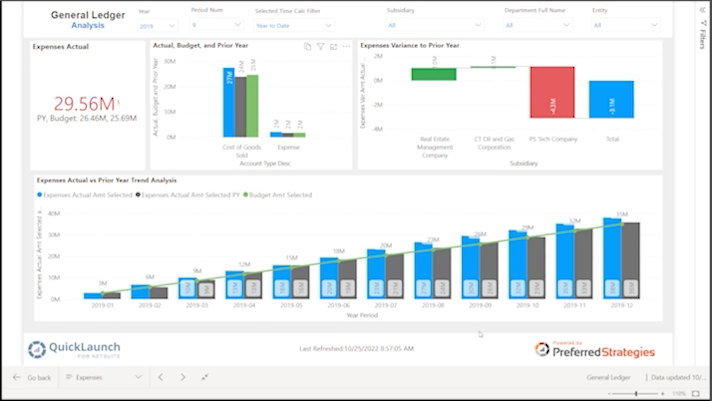
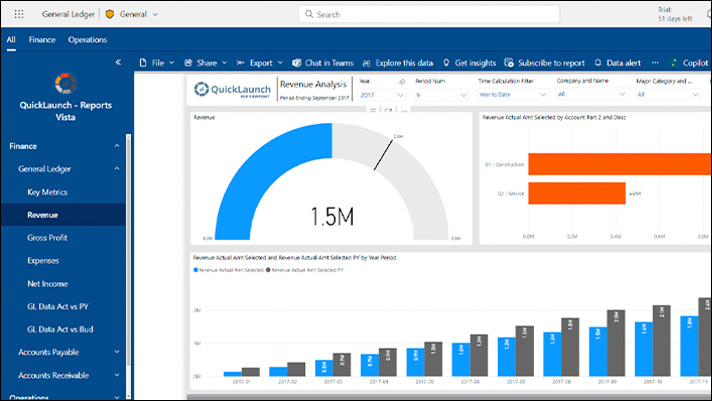
- Revealing the best applications and examples of analytics in the industry: success stories that will excite your executives
- Quantifying the short and long term ROI of investing in analytics: why is it critical to do this work now?
- Understanding what executives need to know when you’re requesting funding or support for investment in analytics
- Explore dozens of pre-built reports, templates, dashboards, and KPIs to deliver faster business insights
- Understand deployment options—on premises, cloud or hybrid hosting
- Translate complex JDE attribute names into a valuable business glossary
- Integrate data governance including calculated values
- Easily solve complex calculations such as aging and calendar-based events
- Learn about dashboard support for all major JDE modules
Let’s Meet
To schedule a custom demo or meeting at INFOCUS, please get in touch. And if you’d like to try our product before the show, you can start a free trial today. See you in Denver! [post_title] => Let’s Meet at JD Edwards INFOCUS 2019! [post_excerpt] => INFOCUS is just a month away. We look forward to three great days of networking, learning, and fun! Let’s connect in Denver: Visit us in Booth #322 Come by for your personal QuickLaunch™ demo! We can’t wait to show you how QuickLaunch makes it fast and easy to implement self-service JD Edwards reporting and analytics with Microsoft® Power BI and other modern BI tools. [post_status] => publish [comment_status] => closed [ping_status] => open [post_password] => [post_name] => lets-meet-at-jd-edwards-infocus-2019 [to_ping] => [pinged] => [post_modified] => 2022-12-12 14:03:51 [post_modified_gmt] => 2022-12-12 22:03:51 [post_content_filtered] => [post_parent] => 0 [guid] => https://preferredstrategies.com/?p=5893 [menu_order] => 13 [post_type] => post [post_mime_type] => [comment_count] => 0 [filter] => raw ) [5] => WP_Post Object ( [ID] => 5884 [post_author] => 6 [post_date] => 2019-07-02 13:42:57 [post_date_gmt] => 2019-07-02 21:42:57 [post_content] => [post_title] => Tips & Tricks: JDE Reports & Dashboards Made Easy [post_excerpt] => During this demo-rich presentation, we show you just how easy it is to create stunning, informative and interactive dashboards for JD Edwards in minutes with QuickLaunch™ for Microsoft® Power BI. [post_status] => publish [comment_status] => closed [ping_status] => closed [post_password] => [post_name] => tips-tricks-jde-reports-dashboards-made-easy [to_ping] => [pinged] => [post_modified] => 2022-10-21 15:57:20 [post_modified_gmt] => 2022-10-21 22:57:20 [post_content_filtered] => [post_parent] => 0 [guid] => https://preferredstrategies.com/?post_type=resource&p=5884 [menu_order] => 39 [post_type] => resource [post_mime_type] => [comment_count] => 0 [filter] => raw ) [6] => WP_Post Object ( [ID] => 5874 [post_author] => 6 [post_date] => 2019-05-31 20:00:16 [post_date_gmt] => 2019-06-01 04:00:16 [post_content] => [post_title] => Innocor, Inc. Gets Comfortable with Modern BI Tools [post_excerpt] => Join this webinar to learn about the JD Edwards reporting & analytics challenges that Innocor, Inc. was facing, the solutions they selected, and the results achieved. [post_status] => publish [comment_status] => closed [ping_status] => closed [post_password] => [post_name] => innocor-inc-gets-comfortable-with-modern-bi-tools [to_ping] => [pinged] => [post_modified] => 2022-10-21 15:59:34 [post_modified_gmt] => 2022-10-21 22:59:34 [post_content_filtered] => [post_parent] => 0 [guid] => https://preferredstrategies.com/?post_type=resource&p=5874 [menu_order] => 41 [post_type] => resource [post_mime_type] => [comment_count] => 0 [filter] => raw ) [7] => WP_Post Object ( [ID] => 5805 [post_author] => 6 [post_date] => 2019-05-01 01:04:49 [post_date_gmt] => 2019-05-01 09:04:49 [post_content] => [post_title] => Got Power BI with JD Edwards? [post_excerpt] => In this webcast recording we demonstrate how to create dashboards for JDE in minutes using Preferred Strategies QuickLaunch and Microsoft Power BI. Viewers will also gain an understanding of JDE data discovery and prep challenges, and explore BI and visualization dashboarding tools for JDE. [post_status] => publish [comment_status] => closed [ping_status] => closed [post_password] => [post_name] => got-power-bi-with-jd-edwards [to_ping] => [pinged] => [post_modified] => 2022-10-21 16:00:52 [post_modified_gmt] => 2022-10-21 23:00:52 [post_content_filtered] => [post_parent] => 0 [guid] => https://preferredstrategies.com/?post_type=resource&p=5805 [menu_order] => 55 [post_type] => resource [post_mime_type] => [comment_count] => 0 [filter] => raw ) [8] => WP_Post Object ( [ID] => 5352 [post_author] => 6 [post_date] => 2019-02-01 07:21:35 [post_date_gmt] => 2019-02-01 15:21:35 [post_content] => [post_title] => Considerations for your JDE Self-Service Data Hosting Environment [post_excerpt] => All three leading public cloud computing platforms; Amazon AWS, Microsoft Azure and GoogleCloud are going gangbusters. They are offering more and more storage and bandwidth for less money as they compete for market share. This is great for companies considering options for hosting their JDE data. This video will help you determine the best approach for you based on these and other factors. It also provides high-level functional block diagrams for the various deployment options. [post_status] => publish [comment_status] => closed [ping_status] => closed [post_password] => [post_name] => considerations-for-your-jde-self-service-data-hosting-environment [to_ping] => [pinged] => [post_modified] => 2022-10-21 16:03:52 [post_modified_gmt] => 2022-10-21 23:03:52 [post_content_filtered] => [post_parent] => 0 [guid] => https://preferredstrategies.com/?post_type=resource&p=5352 [menu_order] => 42 [post_type] => resource [post_mime_type] => [comment_count] => 0 [filter] => raw ) ) [post_count] => 9 [current_post] => -1 [before_loop] => 1 [in_the_loop] => [post] => WP_Post Object ( [ID] => 6033 [post_author] => 10 [post_date] => 2019-11-26 08:27:09 [post_date_gmt] => 2019-11-26 16:27:09 [post_content] => We are always grateful, and especially at Thanksgiving, for the brilliant customers, innovative partners, engaged community, and dedicated employees that make Preferred Strategies possible. May you indulge in some well-earned time off, however you decide to spend it. Once again we’ve curated some fun Thanksgiving-related articles and visualizations for your post-turkey reading. Enjoy! 1. Let's Talk Turkey Whether you prefer leg, breast, or rump, Bourbon Red or White Holland, you’d better know what you’re eating. 2. Turkey Day Exposé: How Americans Really Feel About the Big Dinner
Fill up on this feast of facts.
 Source: The Harris Poll for Instacart
3. Mapping Thanksgiving
A round-up of data, charts, and graphs to make your holiday weekend logistics a breeze.
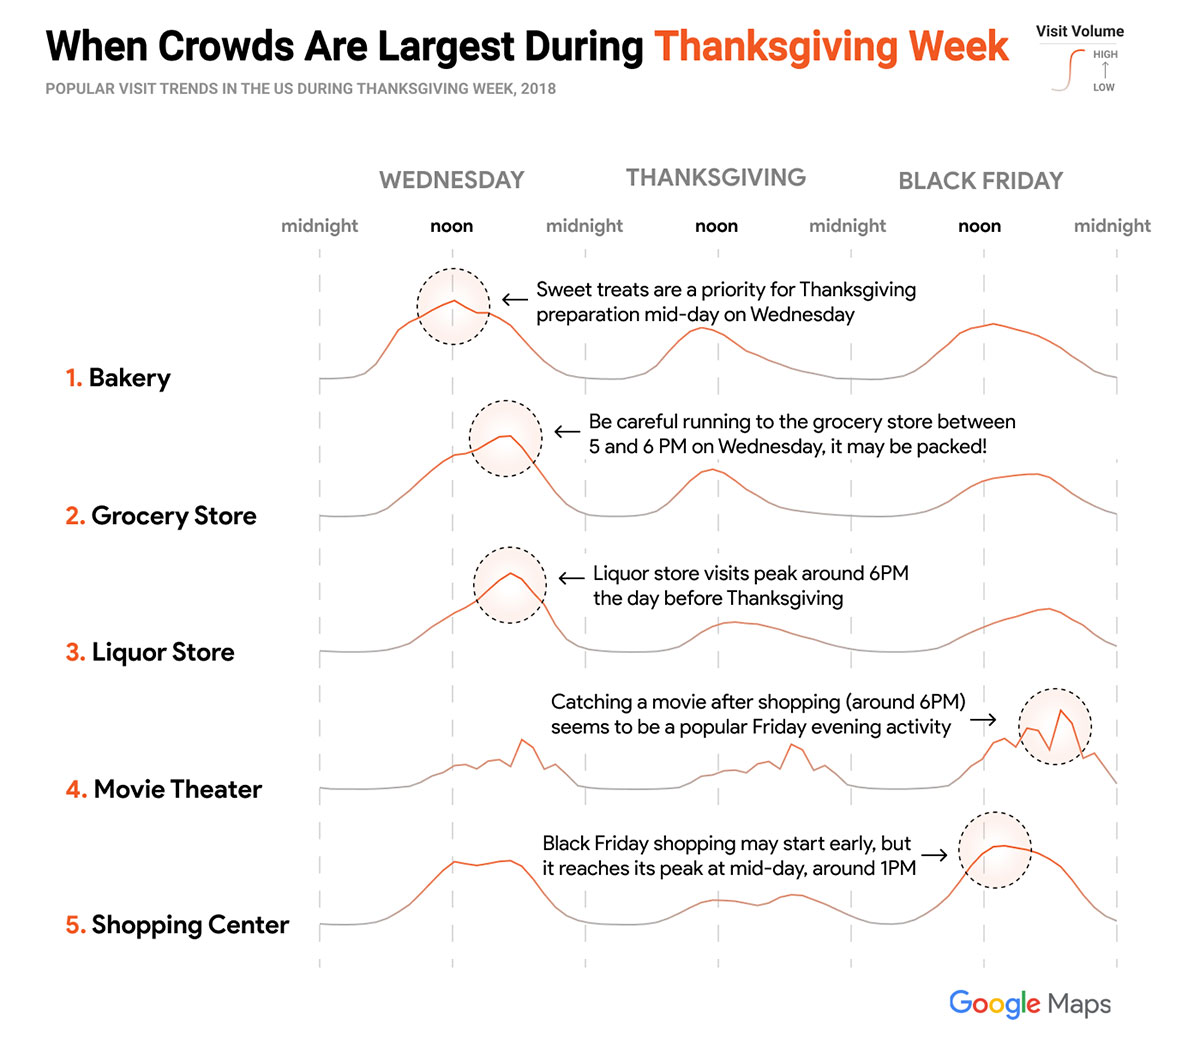 Source: Google Maps and Google News Lab
4. Seven Charts That Will Save You All The Stress On Thanksgiving
All the food, none of the fails.
 Source: Delish
5. Thanksgiving Weather Forecast
Thanksgiving travel could be disrupted by rain and snow across the U.S. Here’s what to know.
 Source: Time
6. Thanksgiving and the NFL
Learn how the football-on-Thanksgiving tradition began.
 Source: Pro Football Hall of Fame
7. By the Numbers: 2019 Thanksgiving Travel Forecast
More than 55 million travelers are taking to the roads and skies this Thanksgiving.
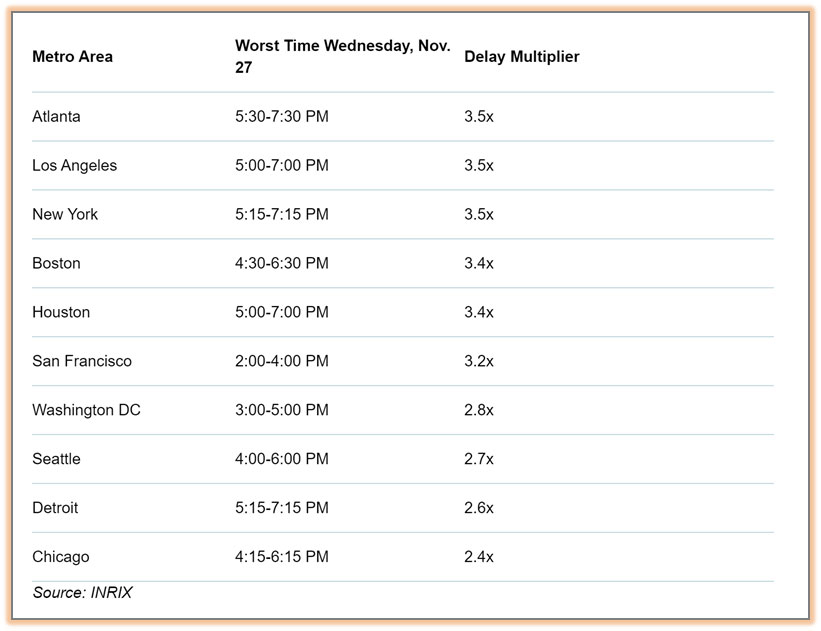 Source: AAA and INRIX
8. The Ultimate Thanksgiving Drinking Game
Silly good fun whether you imbibe or not!
 Source: BuzzFeed
9. GivingTuesday Is December 3
Join the global generosity movement.
 Source: GivingTuesday
[post_title] => Thanksgiving Visualized: The Holiday in Maps, Charts and Graphics
[post_excerpt] => Once again we’ve curated some fun Thanksgiving-related articles and visualizations for your post-turkey reading. Enjoy!
[post_status] => publish
[comment_status] => closed
[ping_status] => open
[post_password] =>
[post_name] => thanksgiving-charts-maps-and-graphics
[to_ping] =>
[pinged] =>
[post_modified] => 2021-08-23 18:04:46
[post_modified_gmt] => 2021-08-23 18:04:46
[post_content_filtered] =>
[post_parent] => 0
[guid] => https://preferredstrategies.com/?p=6033
[menu_order] => 12
[post_type] => post
[post_mime_type] =>
[comment_count] => 0
[filter] => raw
)
[comment_count] => 0
[current_comment] => -1
[found_posts] => 112
[max_num_pages] => 13
[max_num_comment_pages] => 0
[is_single] =>
[is_preview] =>
[is_page] =>
[is_archive] =>
[is_date] =>
[is_year] =>
[is_month] =>
[is_day] =>
[is_time] =>
[is_author] =>
[is_category] =>
[is_tag] =>
[is_tax] =>
[is_search] =>
[is_feed] =>
[is_comment_feed] =>
[is_trackback] =>
[is_home] => 1
[is_privacy_policy] =>
[is_404] =>
[is_embed] =>
[is_paged] => 1
[is_admin] =>
[is_attachment] =>
[is_singular] =>
[is_robots] =>
[is_favicon] =>
[is_posts_page] =>
[is_post_type_archive] =>
[query_vars_hash:WP_Query:private] => 19878e539ab5cf011238277de2f3c829
[query_vars_changed:WP_Query:private] =>
[thumbnails_cached] =>
[allow_query_attachment_by_filename:protected] =>
[stopwords:WP_Query:private] =>
[compat_fields:WP_Query:private] => Array
(
[0] => query_vars_hash
[1] => query_vars_changed
)
[compat_methods:WP_Query:private] => Array
(
[0] => init_query_flags
[1] => parse_tax_query
)
)
Once again we’ve curated some fun Thanksgiving-related articles and visualizations for your post-turkey reading. Enjoy!

In this demo-rich webinar we will walk through how to best set up and manage UDC fields for reporting and analytics.
In this webcast presented in partnership with GSI, we address some of the common challenges and considerations to incorporating modern BI tools into your workflow.

Preferred Strategies QuickLaunch™ is a packaged software accelerator designed to enable business users outside of IT to develop Viewpoint analytics and business intelligence quickly using easily adopted, modern BI tools such as Microsoft® Power BI, Tableau®, Qlik® and a host of others.
INFOCUS is just a month away. We look forward to three great days of networking, learning, and fun! Let’s connect in Denver: Visit us in Booth #322 Come by for your personal QuickLaunch™ demo! We can’t wait to show you how QuickLaunch makes it fast and easy to implement self-service JD Edwards reporting and analytics with Microsoft® Power BI and other modern BI tools.

During this demo-rich presentation, we show you just how easy it is to create stunning, informative and interactive dashboards for JD Edwards in minutes with QuickLaunch™ for Microsoft® Power BI.

Join this webinar to learn about the JD Edwards reporting & analytics challenges that Innocor, Inc. was facing, the solutions they selected, and the results achieved.

In this webcast recording we demonstrate how to create dashboards for JDE in minutes using Preferred Strategies QuickLaunch and Microsoft Power BI. Viewers will also gain an understanding of JDE data discovery and prep challenges, and explore BI and visualization dashboarding tools for JDE.
All three leading public cloud computing platforms; Amazon AWS, Microsoft Azure and GoogleCloud are going gangbusters. They are offering more and more storage and bandwidth for less money as they compete for market share. This is great for companies considering options for hosting their JDE data. This video will help you determine the best approach for you based on these and other factors. It also provides high-level functional block diagrams for the various deployment options.


