Community
Support
Contact
Products
QuickLaunch for JDE
QuickLaunch for Viewpoint
QuickLaunch for Salesforce
QuickLaunch for NetSuite
Power Analytics for OneStream
About
About Us
Customers
Why Trust
Partners
Careers
In the News
Resources
Resource Library
Case Studies
Customer Roundtable
Demos
Educational Sessions
Videos
Whitepapers
Blog
In the News
Events
Product Tours
Book A Demo
Skip to content
Main Navigation
Products
QuickLaunch for JDE
QuickLaunch for Viewpoint
QuickLaunch for Salesforce
QuickLaunch for NetSuite
Power Analytics for OneStream
About
About Us
Customers
Why Trust
Partners
Careers
In the News
Resources
Resource Library
Case Studies
Customer Roundtable
Demos
Educational Sessions
Videos
Whitepapers
Blog
In the News
Events
Product Tours
Book A Demo
Tag:
data visualization tools
Products Tours
QuickLaunch for JDE
TAKE A TOUR
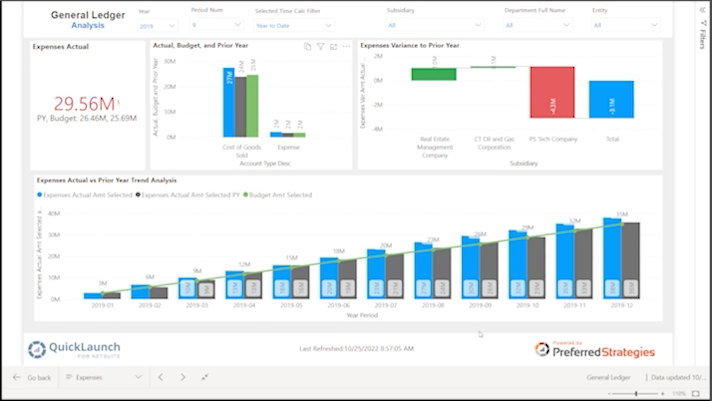
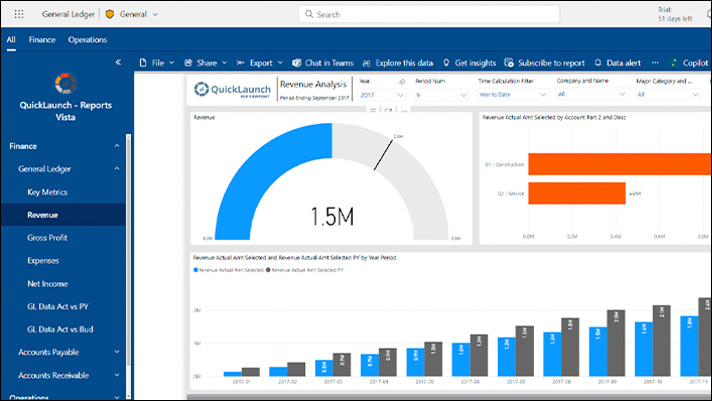
QuickLaunch for Vista
TAKE A TOUR