Thanksgiving Visualized: The Holiday in Maps, Charts and Graphics

Avatar photo

By Preferred Strategies  |  November 26, 2019

We are always grateful, and especially at Thanksgiving, for the brilliant customers, innovative partners, engaged community, and dedicated employees that make Preferred Strategies possible. May you indulge in some well-earned time off, however you decide to spend it.

Once again we’ve curated some fun Thanksgiving-related articles and visualizations for your post-turkey reading. Enjoy!


1. Let’s Talk Turkey

Whether you prefer leg, breast, or rump, Bourbon Red or White Holland, you’d better know what you’re eating. 


2. Turkey Day Exposé: How Americans Really Feel About the Big Dinner

Fill up on this feast of facts.

Source: The Harris Poll for Instacart


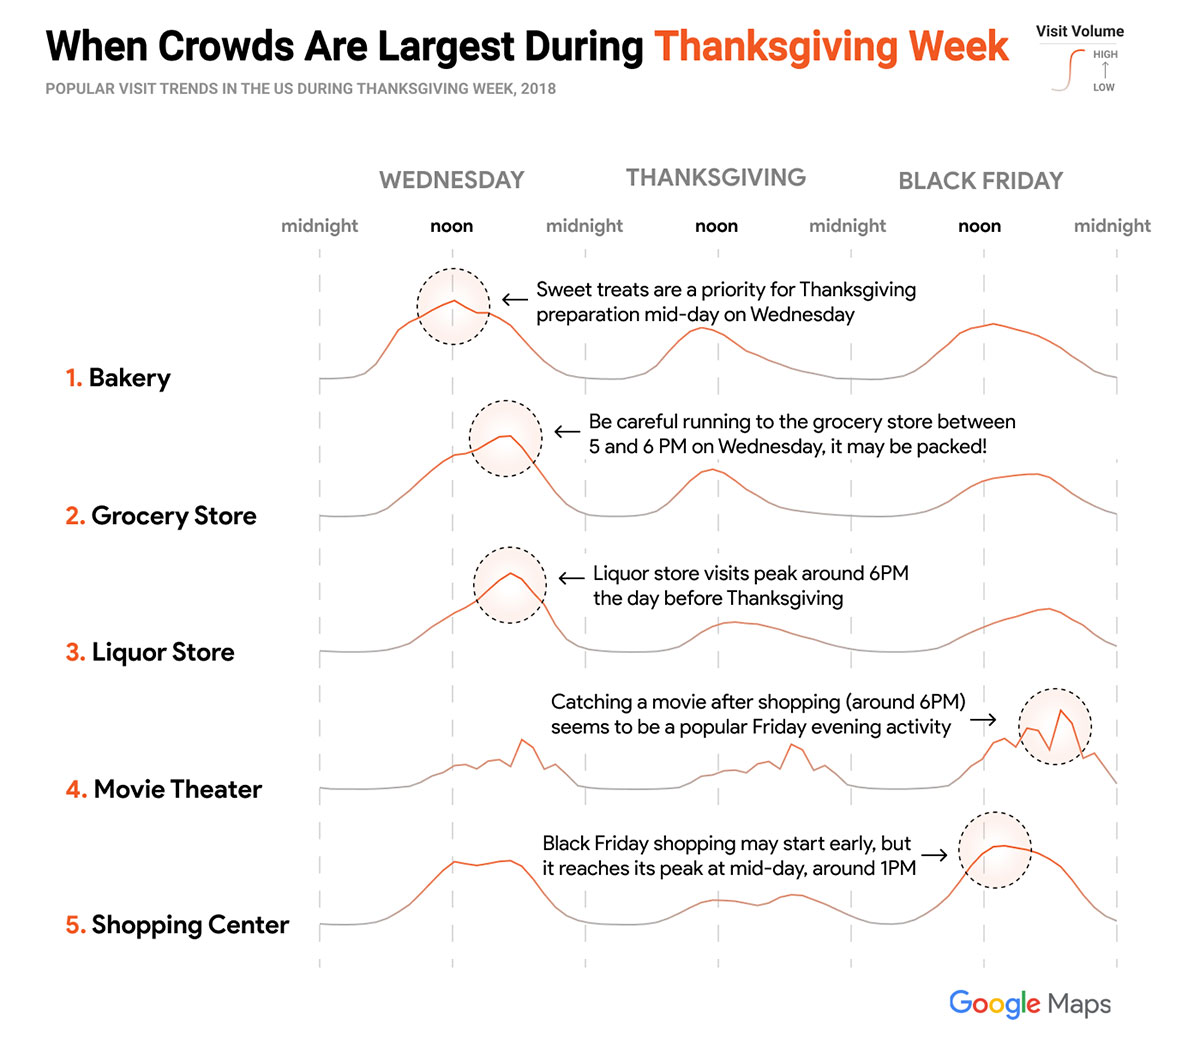
3. Mapping Thanksgiving

A round-up of data, charts, and graphs to make your holiday weekend logistics a breeze.

Source: Google Maps and Google News Lab


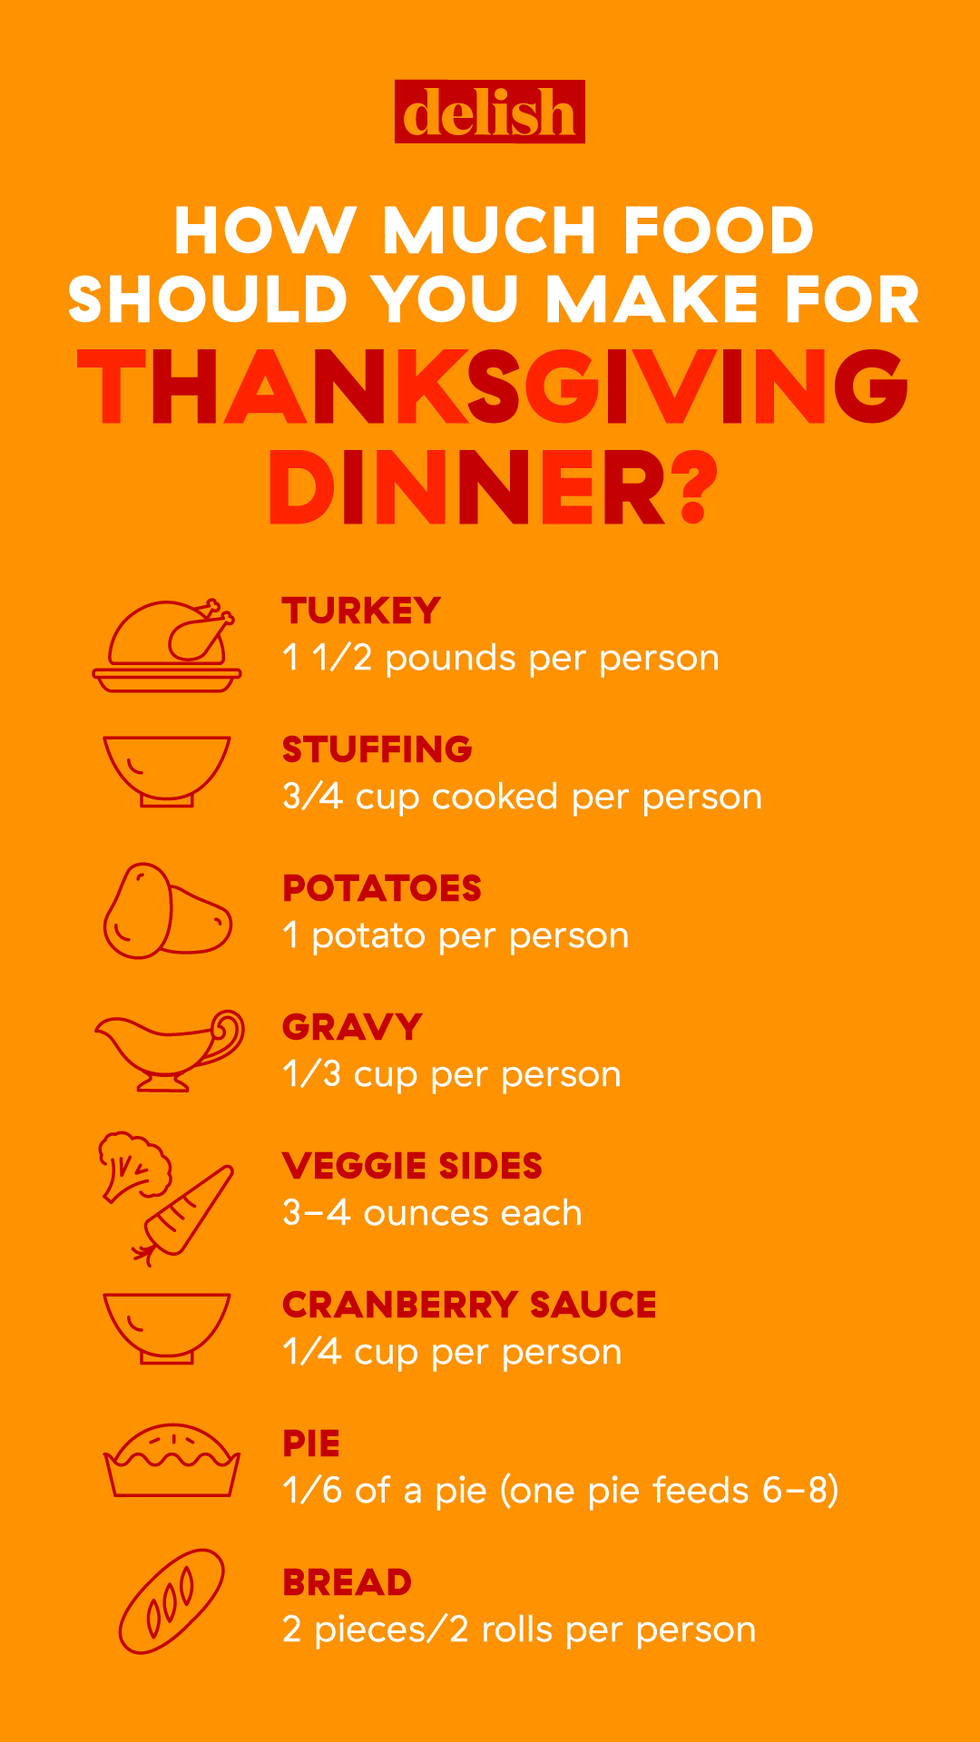
4. Seven Charts That Will Save You All The Stress On Thanksgiving

All the food, none of the fails.

Source: Delish


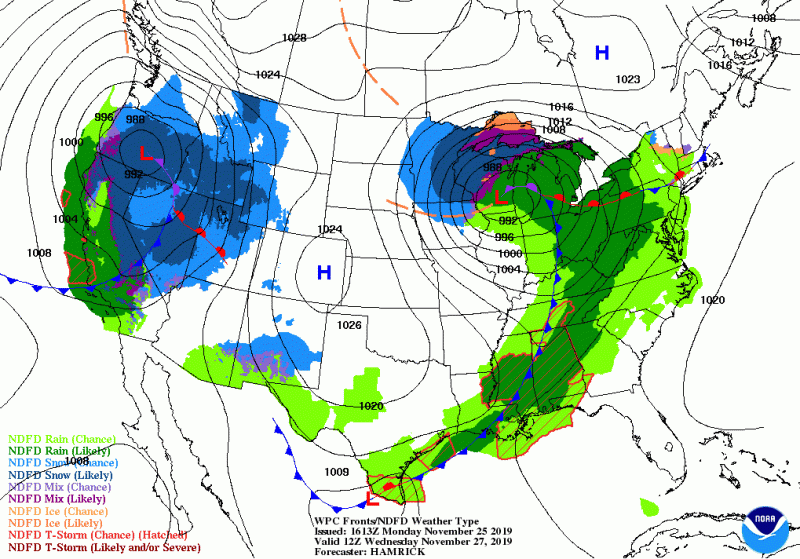
5. Thanksgiving Weather Forecast

Thanksgiving travel could be disrupted by rain and snow across the U.S. Here’s what to know.

Source: Time


6. Thanksgiving and the NFL

Learn how the football-on-Thanksgiving tradition began.

Source: Pro Football Hall of Fame


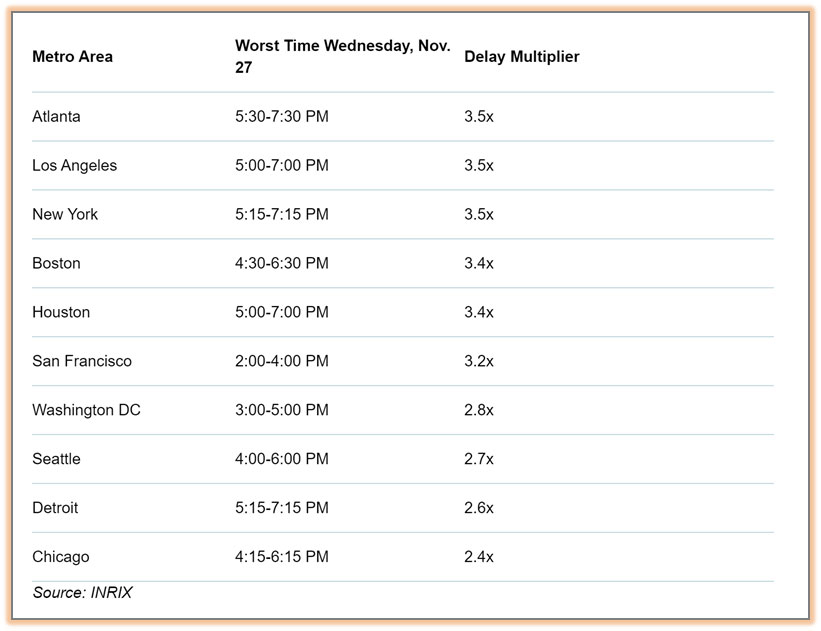
7. By the Numbers: 2019 Thanksgiving Travel Forecast

More than 55 million travelers are taking to the roads and skies this Thanksgiving.

Source: AAA and INRIX


8. The Ultimate Thanksgiving Drinking Game

Silly good fun whether you imbibe or not!

Source: BuzzFeed


9. GivingTuesday Is December 3

Join the global generosity movement.

Source: GivingTuesday

Avatar photo

About the Author

Preferred Strategies

Preferred Strategies is helping hundreds of JD Edwards and Viewpoint Vista customers to realize the full potential of their ERP data through the innovative Preferred Strategies QuickLaunch product.

Related Articles

June 19, 2024
Maximize Efficiency with Supply and Demand Planning Analytics for JD Edwards

Today, according to Allied Market Research on Supply Chain Management, only 6% of companies claim to have full visibility into their supply chain. Furthermore, their 2023 report claims that organizations can double profits by reducing supply chain costs. This indicates that most companies can stand to make a lot more money if they are able to increase transparency through better access to supply chain information and more efficient processes. At Preferred Strategies, we’ve been helping manufacturing companies that run JD Edwards gain visibility into their supply chain processes since 2002 with our QuickLaunch for JDE solution. The latest QuickLaunch product

Read More >
November 03, 2023
QuickLaunch for Vista Release Notes: Payroll Detail, Equipment Maintenance, Warranty Details and Much More!

We’re always looking to make improvements here at Preferred Strategies and lately, we’ve been busy! Vista Release Notes is our blog series that showcases recent product improvements to help you stay up to date on what’s new.

Read More >
June 29, 2023
Power BI Updates for Enterprise Analytics: Q2 2023 – Part 1

As we move towards the holiday season, let’s review what the Power BI team has been up to over the summer and early fall of 2023.

Read More >