NCAA Basketball 2018 March Madness Tournament Breakdown with Power BI
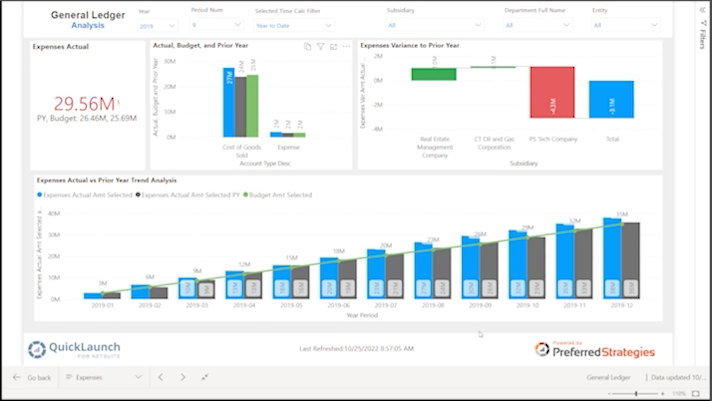
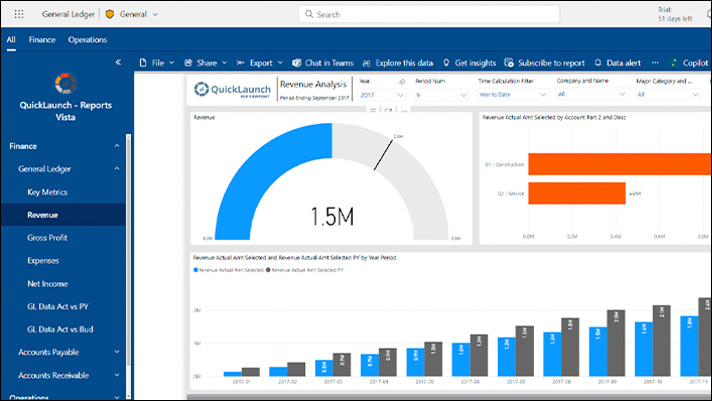
In this Power BI report, view an overview of the 68 team field by the Regional Divisions to see how the bracket is distributed for various key basketball stats. Check out the Head-to-Head matchup page for individual game analysis. (Oh, and just in case of emergency click the Boss report tab to appear like you are working!)
|
Expand the report full screen seen here. |
 |
|

If you need help navigating this Power BI report for drill-down and filter analysis, download the Preferred Strategies Power BI navigation guide here.
This report was produced using Microsoft Power BI. If you are interested in taking a deeper dive into Power BI and QuickLaunch for JD Edwards, sign up for a Free Trial where Preferred Strategies will setup a trial account for you so you can create your own beautiful reports and dashboards in a Power BI JD Edwards sandbox environment. Select the button above to sign up and Preferred Strategies will create your account and direct you on how to get started.