Microsoft Power BI Job Cost Analysis for JD Edwards
|
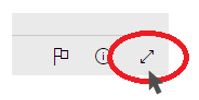
Expand the report full screen seen here. |
 |
Who is this JD Edwards Job Cost analysis intended for? Executives, Project Managers, Purchasing Agents, Analysts, HR – Payroll, and Data Enthusiasts
This Job Cost analysis evaluates job revenues, profits, and costs by revised budget, projected final, and actual amounts so that business users can easily spot job costs trends within your organization. Furthermore, BI analyses like the one below can be used to monitor what your best and worst performing jobs are by region, division and project manager. Reports like these can help drive successful job completion on under budget, aid in organizational negotiations and improve vendor and customer relationships.
Quickly address important business questions like:
- Are the current job costs trends meeting organizational goals?
- How are cost, revenue and profit measures now compared to last month, quarter, or year by division, project manager, and job?
- Which divisions, regions, project managers, and jobs are performing the best and worst?
- Where are your most profitable jobs and who is managing them?
If you need help navigating this Power BI report for drill-down and filter analysis, download the Preferred Strategies Power BI navigation guide here.
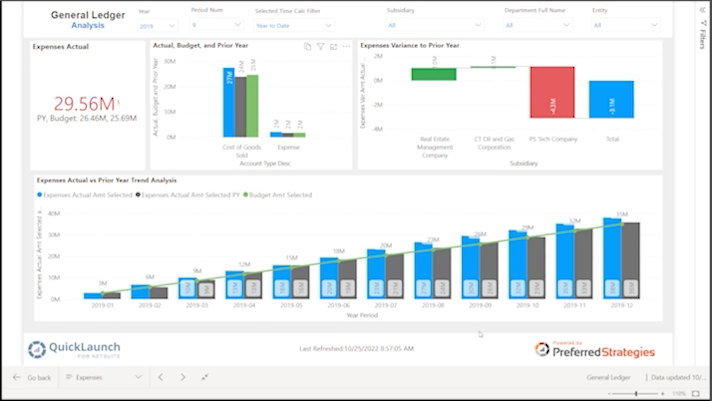
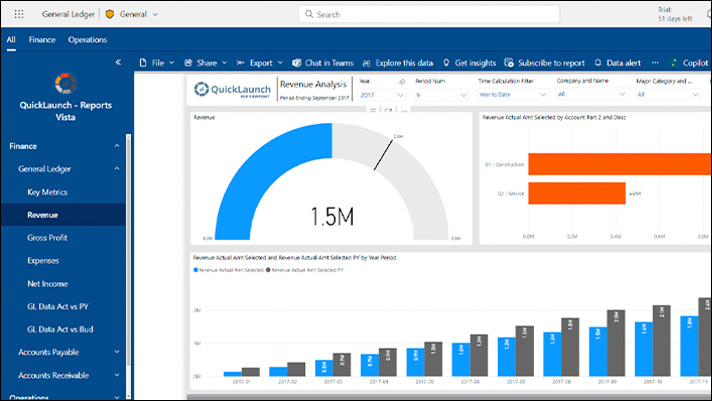
This report was produced using Microsoft Power BI and BI QuickLaunch for JD Edwards over JDE sample Job Cost data. If you are interested in taking a deeper dive into Power BI and QuickLaunch for JD Edwards, sign up for a Free Trial where Preferred Strategies will setup a trial account for you so you can create your own beautiful reports and dashboards in a Power BI JD Edwards sandbox environment. Select the button below to sign up and Preferred Strategies will create your account and direct you on how to get started.


