Microsoft Power BI Inventory Analysis Report for JD Edwards
Who is this JD Edwards Inventory analysis intended for? Operations and Procurement Managers, Purchasing Agents, Analysts, and Data Enthusiasts
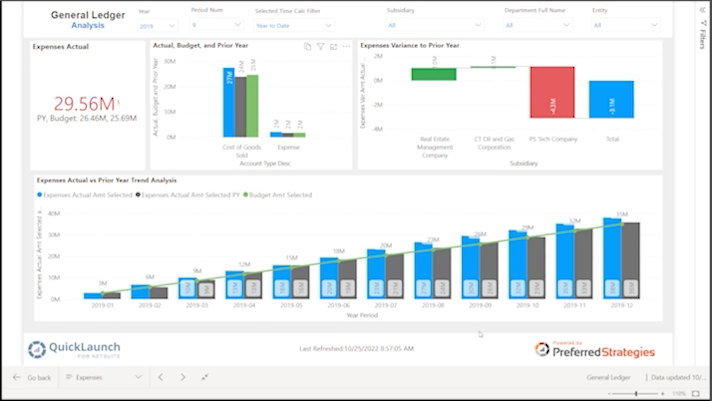
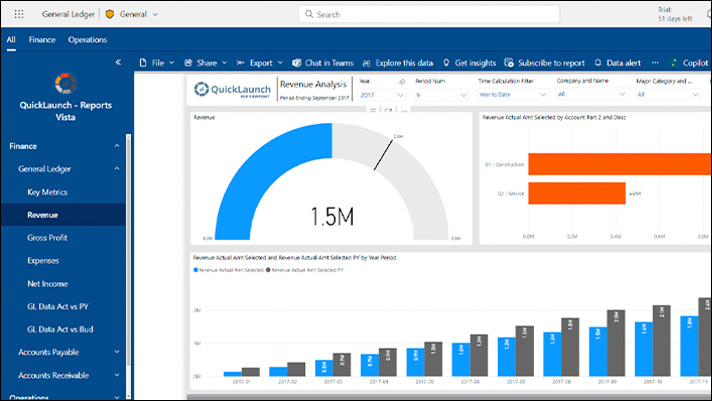
The ability to consistently track inventory KPI’s and trends are crucial to minimizing holding costs, fulfilling customer demand, and improving the company’s bottom line. With reports and dashboards like the examples above, organizations can effectively monitor, control, and optimize their inventory management systems. Keeping your inventory in check is very important for the running of your business. ServiceMax software can help businesses achieve this, keeping on top of your inventory in the best way possible.
Quickly address important business questions like:
- How are my inventory levels trending from a cost and quantity perspective?
- What are my inventory balances this period compared to prior periods?
- What is my inventory turnover, inventory-to-sales ratio, and backorder rates?
If you need help navigating this Power BI report for drill-down and filter analysis, download the Preferred Strategies Power BI navigation guide here.
This report was produced using Microsoft Power BI and QuickLaunch for JD Edwards over JDE sample sales data. If you are interested in taking a deeper dive into Power BI and QuickLaunch for JD Edwards, sign up for a Free Trial where Preferred Strategies will set up a trial account for you so you can create your own beautiful reports and dashboards in a Power BI JD Edwards sandbox environment. Select the button below to sign up and Preferred Strategies will create your account and direct you on how to get started.


