Refining Data to Save Millions with Analytics, IoT and JDE
Company Snapshot

Company:
The International Group, Inc.
Industry:
Manufacturing
Challenge:
Build a modern infrastructure for enterprise analytics, combining JDE data with other core systems data.
Solution:
Implement Preferred Strategies QuickLaunchTM for Microsoft®️ Power BI for JD Edwards.
Result:
Dramatically improved AR and Finance workflows plus in-depth production planning, saving the company millions of dollars.
The International Group, Inc. (IGI) has been in the wax business for over 75 years and is the world’s only dedicated paraffin and microcrystalline wax producer utilizing internally sourced materials. The company owns and operates a fully integrated wax supply chain including waxy crude production, multiple refineries, blend plants and transloading facilities.
Data Waits for No One
IGI’s business is complex. With headquarters in Toronto and seven operations in the United States, it would be no small undertaking to embrace digital transformation. Yet the IGI management team did just that in late 2018 when they decided to undertake an enterprise analytics project.
Selecting a business intelligence tool was straightforward. The team evaluated the top software and chose Microsoft® Power BI based on market leadership, feature set, and product roadmap. The next order of business was to build a data warehouse to make data from their JD Edwards ERP system and other corporate systems available to users
for analysis and visualization.
The IT team met with several large, established vendors. It quickly became clear that the approaches they offered would take three years, two full-time internal staff members, and over $1 million to complete the project. The greatest point of concern was opportunity cost: Which data-driven insights—and their corresponding impact on the bottom line— would the company miss while waiting?
Thinking Outside the Box
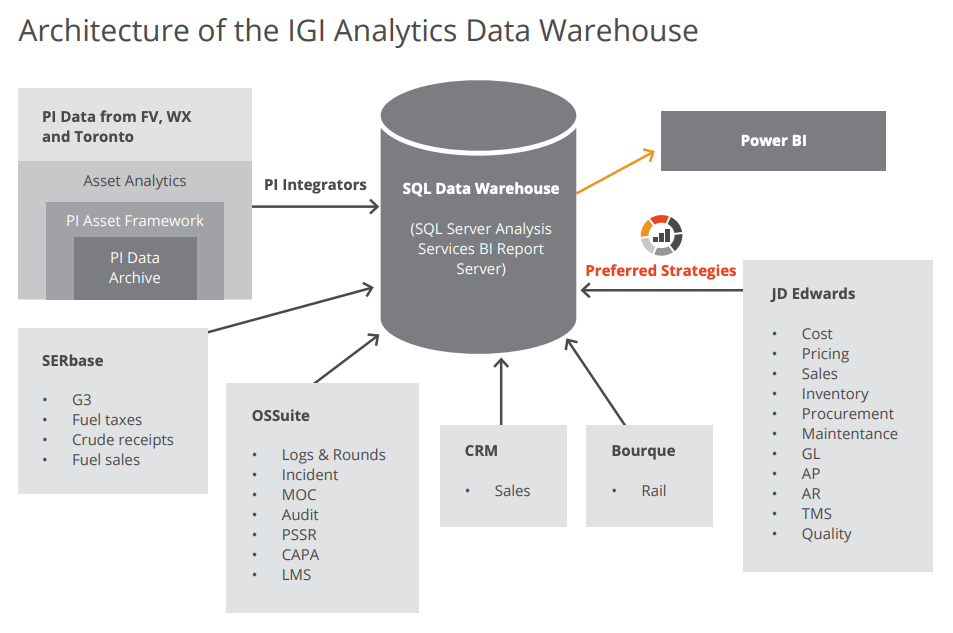
Searching for a more nimble solution, Bill Sandblom, MIS Director for IGI, discovered Preferred Strategies, experts in JD Edwards reporting and analytics with Power BI. A new analytics data warehouse architecture quickly took shape: Microsoft SQL Server sat at its core, with Preferred Strategies QuickLaunch™ seamlessly connecting IGI’s nine-module JD Edwards system to the SQL Server and Power BI, demystifying cryptic JDE data values along the way. Using QuickLaunch, the first rollout, encompassing most of the modules, took six weeks—at a fraction of the cost and literally years faster than the traditional vendors had quoted.
Early Success with Accounts Receivable Drives Adoption
Architecting the analytics data warehouse was a huge achievement. The next challenge would be getting the business to use it—and Accounts Receivable (AR) had an ideal use case.
In the past the AR team did not have an efficient way to manage customers and collection. If a customer called to inquire about being on credit hold, it would take half a day to pull all of the data on that customer—payment history, days late, etc. The lengthy process was frustrating to everyone involved. With QuickLaunch and Power BI, this task takes seconds because the data is instantly available. AR staff can now work with customers in real time to resolve issues, the result being happier customers and more efficient collections.
“The AR project has been an over-the-top success,” said Sandblom. The team can see trends, easily identify who has paid, and more. The new reporting system is an integral part of their daily work.
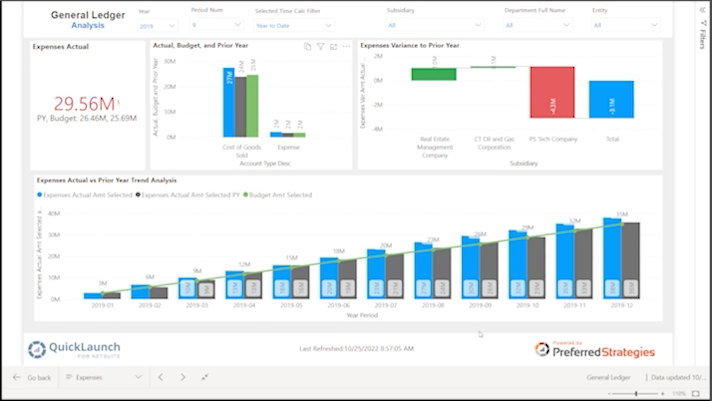
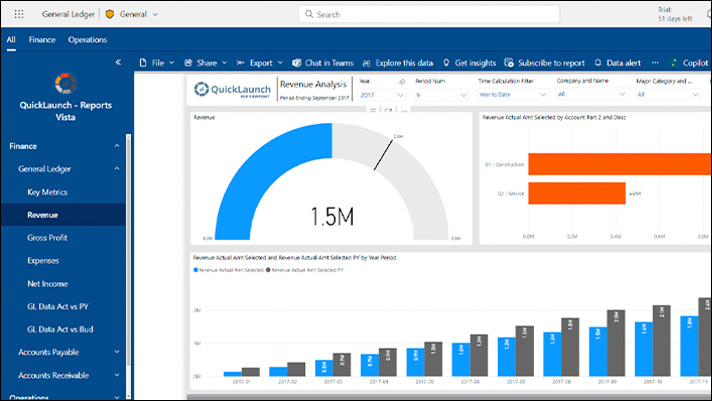
Saving Time on Financial Reporting
On the heels of AR’s success, it made sense to move on to financial reporting—income statements, balance sheets, etc. Under the existing process, the CFO spends days on month-end close, pulling reports out of JDE and then consolidating the data manually. With the QuickLaunch and Power BI project currently underway, the CFO will have instant access to data as soon as it posts which will dramatically speed the close process.
Not only does the finance team look forward to saving time on reporting, but they also anticipate that audits will soon become more efficient. Instead of chasing down specific reports in response to auditors’ requests, the accounting team will simply be able to give auditors access to the data and they can drill down to the extent needed on their own. With QuickLaunch for Power BI, the data will be instantly available.
Production Planning for the Win
With successes in AR and finance, IGI is now pushing forward with a production planning project that will optimize operations and save the company millions every year.
IGI produces about half of the wax they sell, and imports the balance. The company procures its crude in the Midwest and sends that crude to their oil refinery in Utah where they produce a waxy product that goes to their wax refinery plants. The plants produce four different kinds of wax, along with over 5,000 data points, including essential operating details such as tank levels and flows. Before the production planning project, each plant calculated net barrels a bit differently making it impossible to know precisely how many net barrels of crude were available, nor did management have an easy way to know exactly how much of which types of crude or wax were on railcars. Because inventory data wasn’t readily available, they weren’t always able to purchase or produce the right types of wax in the correct quantities. When they were short, they had to purchase extra product at a premium; when they were in excess, they had to sell it at a steep discount. These mistakes were costing the company millions of dollars every year.
To address this, the IT team is developing a KPI dashboard that shows critical metrics such as realtime inventories, average crude flow, tank levels, railcar data, and more. To get a complete picture, IGI is using QuickLaunch to combine JDE and non-JDE data in the same cube, for example railcar data from Bourque Logistics and key IoT data points from their geographically dispersed refineries.
With the new dashboard, senior management planners will have instant access to the data they need to answer critical production questions to optimize inventories. They will be able to send the right product to the right place at the right time, maximizing revenues while saving millions.
Lessons Along the Digital Transformation Journey
Complicated doesn’t have to get in the way of fun. “My team is excited about being part of the analytics project,” said Sandblom. They rush to finish their ‘regular’ work so they can get back to the ‘fun’ project.”
While most business users across the organization are using the pre-built reports and templates created by IT, the vision is to enable a more self-service model and to train champions from each department to be citizen data scientists over time. IGI has already expanded their initial Power BI license to include unlimited seats, and recently purchased an Optimized Data Store (ODS) from Preferred Strategies to further expand their analytics capabilities and lay the groundwork for more advanced initiatives such as machine learning and predictive analytics.
Digital transformation requires a cultural shift across any organization. By leading the way with its BI modernization initiative, IGI management has clearly made a strategic choice to become a data-driven organization.
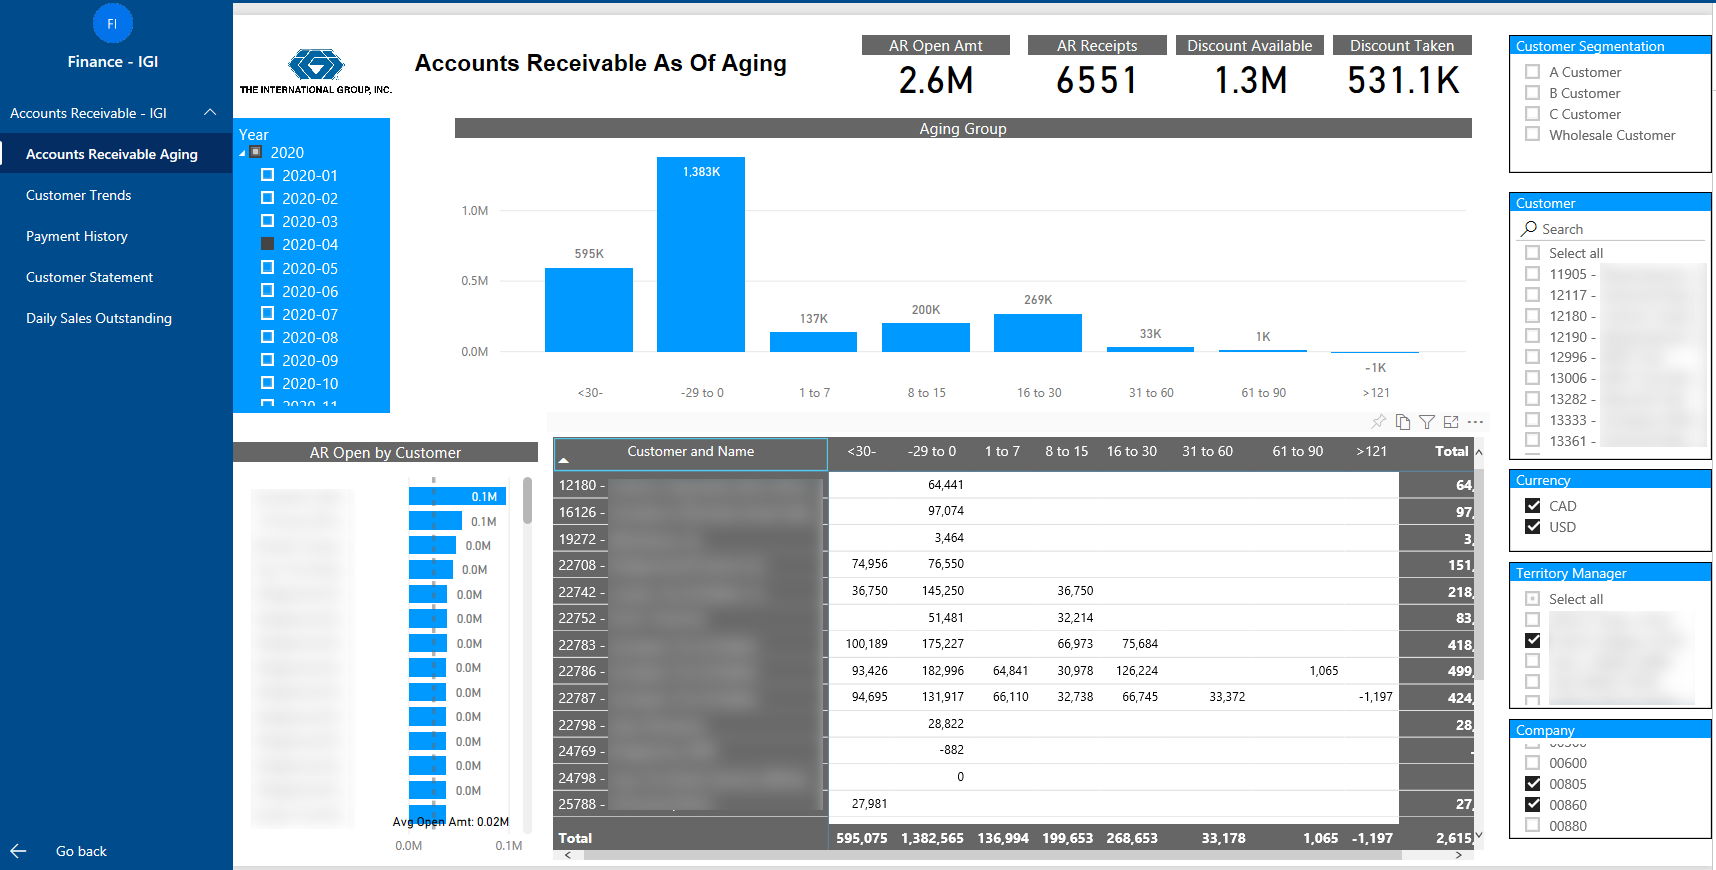
Financial dashboard showing Accounts Receivable as of Aging

Production dashboard showing Crude Unit Flows