Brasfield & Gorrie Brings Data Innovation to Construction
Company Snapshot
![]()
Company:
Brasfield & Gorrie
Industry:
Construction
Challenge:
Make data more accessible and easier to comprehend through visualization.
Solution:
Deploy Preferred Strategies QuickLaunch for Power BI on J D Edwards V9.2 with an on premise operational data store and Microsoft Power BI.
Result:
Business users across the organization are now discovering the value of their corporate data. From finance to HR, to in the field constriction managers, business users and executives now have easy access to data a way to visualize the meaning of the data to make timely business decisions.
Headquartered in Birmingham, Alabama, Brasfield & Gorrie has a rich heritage in the construction industry spanning half a century. Initially, the company focused on small commercial and remodeling projects. As profitability increased, the company shifted its emphasis to larger commercial, institutional, healthcare, and industrial projects. In 1984, Brasfield & Gorrie began further expansion and now serves clients from twelve offices in eight states. With annual revenue of almost $3 billion, the company is a nationally respected general contractor with 2,600 employees and an average project value of $12 million.
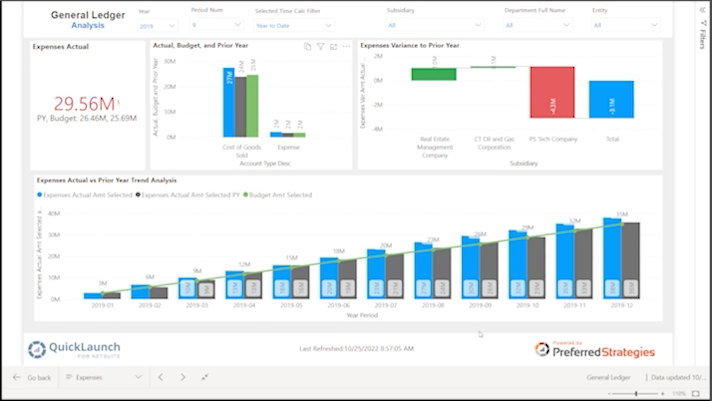
Paper to Dashboards
At the heart of every modern construction project is an ever-increasing volume of data. All aspects of a project are tracked in minute detail to ensure that just-in-time construction and material handling processes remain tightly scheduled, and, in turn, that the project returns a profit. Everything from materials handling to staff time cards are reported, and all of that information resides in the company’s JD Edwards system.
Historically, the company had a paper-driven reporting culture. It was not unusual to have a 300-page printed document circulated around the company to multiple stakeholders, with details and data buried among the pages. As construction projects grew in scope and complexity, it became clear that a new method of reporting—one that was not only more efficient but that also offered more consumable insights—was necessary.
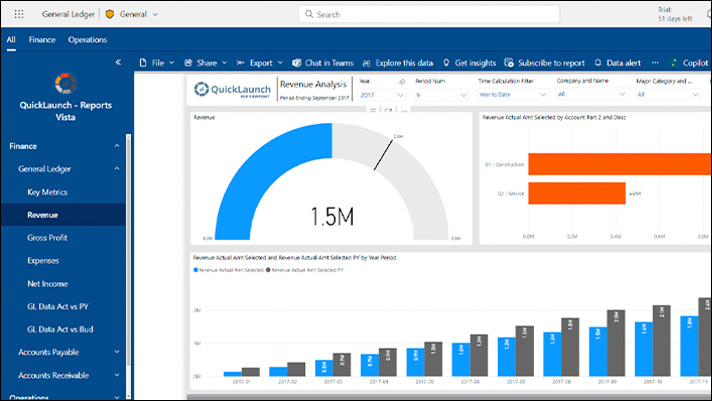
Today, Brasfield & Gorrie is transitioning to a dashboard-based culture where any business user can access and consume data in a self-service model and find the exact data they need immediately. Executives and business users now view data in Microsoft® Power BI visual dashboards, where they can see summary data and also drill down into details. This approach saves time, reduces paper, and makes the data more consumable by a wider audience—leading to better and more timely decision-making.
HR Insights at the Speed of Thought
The HR department was an early adopter of the new self-service data model. Previously, during the bonus and raise cycle, managers across the company would enter information in JD Edwards for their employees. The HR team would then extract spreadsheets for each manager and consolidate them into a single document that might contain over 50 sheets. After consolidation calculations were entered across multiple sheets. HR would then deliver a summary report to the executive team. The problem was that if any point of data changed, and it frequently did, the HR team would have to go back into this unwieldy document and make the calculations all over again.
The team at Brasfield & Gorrie put together a dashboard representing the spread sheet and made that available across the company for managers to enter their bonus and raise data. Changes entered would immediately be reflected in the dashboard and managers could instantly see, through visual representation, whether their department was within budget parameters, compare against other departments and employee levels, get company-wide roll ups, and more. JDE does not provide the manager or HR with an easy way to understand an employee’s compensation at any point in the year. Now the B&G Compensation Analysis Report delivers these insights easily and visually. Another derived benefit of visualizing bonus and raise data is that now compensation outliers stand out visually and can be addressed by the management team. This one activity used to take the HR manager a whole month twice per year. That effort has now been reduced to a few hours.
Applying Visual Reporting & Analytics Across the Company
Today there are over 50 users of Power BI across the company and the number is constantly growing. Because Power BI is so easy to learn, users download the free trial version and start building their own dashboards. Usually IT finds out about this when the user needs access to additional data sets, or it’s time to convert to a paid license.

Following on from the success of reporting and analytics with QuickLaunch and Power BI in finance, sales and construction project management, the company has seen widespread adoption of Power BI visualization and analytics across different departments. IT uses Samanage for their help desk ticket tracking. They have built Power BI dashboards and are getting insights on who is calling, what the most common issues are, and which departments make help desk requests the most. Insights on who is calling, for example, what the age ranges are, geographic distribution and nature of the calls helps the IT department predict how to manage help desk capacity and where additional training might be necessary.
Safety is of the utmost importance for employees in the field. Tracking and reporting safety incidents by geography or certain situations is essential to minimize accidents. Comprehensive incident data is captured such as; time of day/day of week, age and experience of workers, weather conditions, location, etc. From this data insights can be gained, incidents can be avoided, and at-risk conditions identified. These insights have reduced incidents and have helped improve overall job site safety.
Brasfield & Gorrie has deployed PlanGrid to replace 3 X 4 paper plans and now deploy building plans on iPads. This also allows them to track punch list items that need to be addressed prior to hand over to the new building owner. Tracking by job function and sub-contractors helps Brasfield & Gorrie track quality across a project and answer key questions. Are certain sub-contractors better than others at attention to detail so punch list items are limited? This data and Power BI visualization helps Brasfield & Gorrie have a meaningful conversation with sub-contractors at the end of a project.
Brasfield & Gorrie tracks opportunities in Salesforce with win/loss information. They then track revenue and profitability in JD Edwards. Brasfield & Gorrie is now able to calculate hours/$M of revenue. This helps the company more accurately predict how much manpower it will need on a project. This is particularly helpful in construction where craft labor is really hard to find. Being able to anticipate when you will need that labor reduces project delays that can lead to reduced profit. This kind of analysis will completely change the way field recruiting will operate in the future.
QuickLaunch Changes the Game for IT
Brasfield & Gorrie has deployed JD Edwards version 9.2 with an on-premise Operational Data Store to offload reporting and analytics from the JDE transaction system. The company uses multiple JDE modules including Financials, HR/Payroll, Job Cost, Purchasing & Contract Management. Brasfield & Gorrie has partnered with Preferred Strategies for over 10 years. From the early days of Crystal Reports and BusinessObjects to modern visualization and analytics tools such as Microsoft Power BI, Brasfield & Gorrie has depended on Preferred Strategies QuickLaunch to shorten deployment cycles and deliver self-service reporting to the business users.
“Using Preferred Strategies’ Tabular Models has been a tremendous improvement on operations,” says BJ Cail, Director of Business Technology & Intelligence, Brasfield & Gorrie. “One example of how QuickLaunch simplifies our reporting is the handling of dates within JDE, decimal shifting, category codes, etc. is all tracked and normalized by QuickLaunch, significantly reducing reporting complexity.”
Now IT no longer needs to support every data request. Departments across the company are producing their own reports and dashboards. A group of Power BI “power users” from across the organization have regular training sessions to share ideas and insights. Overall the self-service reporting & analytics enabled by QuickLaunch and Power BI has dramatically reduced the workload on the IT team. As the use of Power BI expands across the company the next step is to integrate these dashboards in to the internal Brasfield & Gorrie portal called “Connect” so that everyone can access the data through interactive visualizations within the network or remotely on mobile devices.
At the heart of every construction project is an ever-increasing volume of data that reports everything from materials handling to staff time cards. Construction managers must have easy access to data to make critical business decisions quickly and QuickLaunch and Power BI are doing exactly that at Brasfield & Gorrie.