How to Build JDE Dashboards in minutes that will get you noticed
Data visualizations are one of the most valuable ways that business leaders gain meaning from corporate information. Visualizations help spot trends earlier and help business leaders to react sooner and plan for future business growth and profitability. If your business runs on J D Edwards then you’re sitting on a gold mine of information just waiting to be presented.
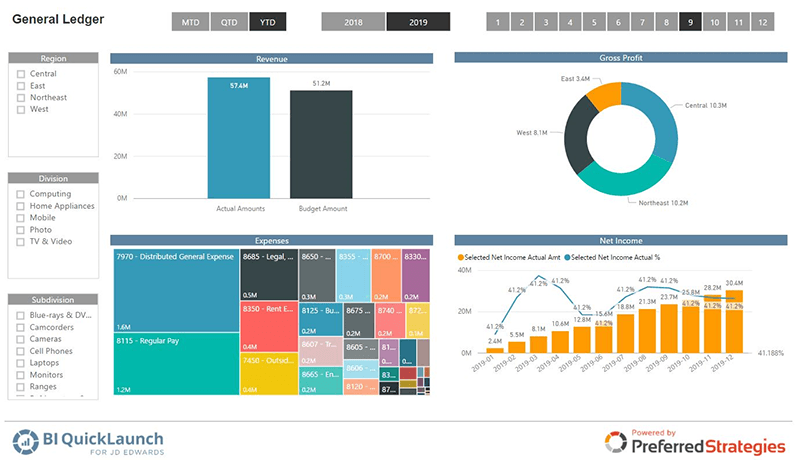
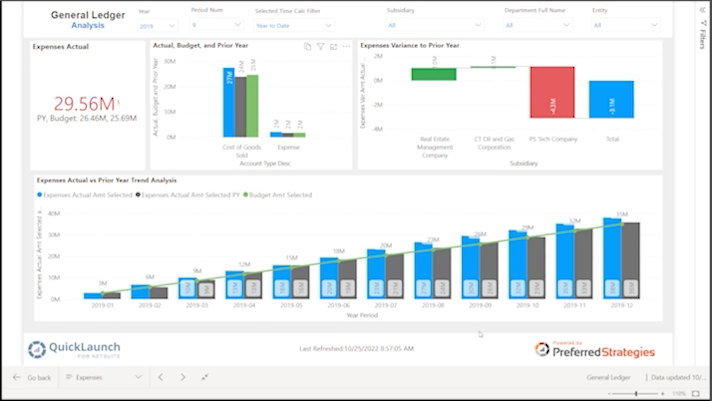
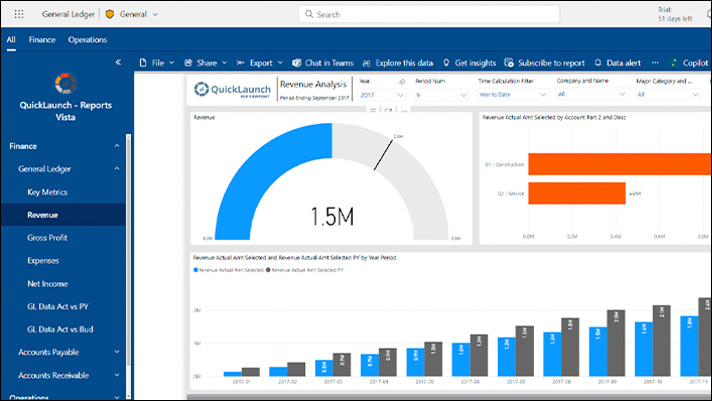
A great visualization dashboard will get you noticed! In this informative webinar, Adam Crigger, Founder & President of Preferred Strategies, will show you how to create an amazing Financial KPI dashboard in minutes using QuickLaunch, the secret sauce to unlocking the full potential of JD Edwards data. You’ll instantly see why dozens of companies using JDE rely on the QuickLaunch advantage every day:
- Supports all the major JDE modules
- Translates complex JDE attribute names into a valuable business glossary
- Dozens of pre-built reports & templates to deliver faster business insights
- Integrated data governance including calculated values
- Easily solves complex calculations such as aging and calendar-based events
- Simple deployment options—on premises, cloud or hybrid hosting
- Quickly integrate other data sources with JDE
We had many great questions during the Q&A and a transcript of the ones we were not able to cover on the webinar is here