Gartner’s Magic Quadrant for Modern Analytics Platforms Analysis
|
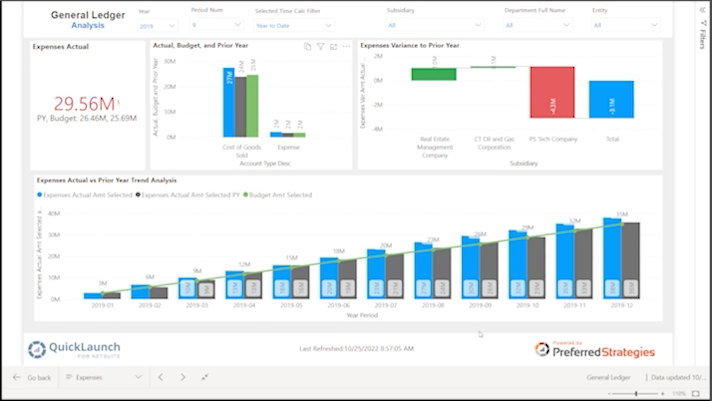
Expand the report full screen seen here. |
 |
|
Who is this Gartner Analysis report intended for? Executives, Managers, IT Personnel, Analysts, and Data Enthusiasts
This Gartner Magic Quadrant report analyzes the top BI and Analytics platforms on the market. You can see how today’s platforms and others have trended over time as far back as 2010 by using the play feature in the bottom left of the scatter chart. Furthermore you can see how these system’s scores for Ability to Execute and Completeness of Vision, the two metrics used to plot the platforms on the Quadrant, have changed in comparison to the total change for all platforms in the waterfall chart on the right.
If you need help navigating this Power BI report for drill-down and filter analysis, download the Preferred Strategies Power BI navigation guide here.
This report was produced using Microsoft Power BI and QuickLaunch for JD Edwards. If you are interested in taking a deeper dive into Power BI and QuickLaunch for JD Edwards, sign up for a Free Trial where Preferred Strategies will setup a trial account for you so you can create your own beautiful reports and dashboards in a Power BI JD Edwards sandbox environment. Select the button below to sign up and Preferred Strategies will create your account and direct you on how to get started.