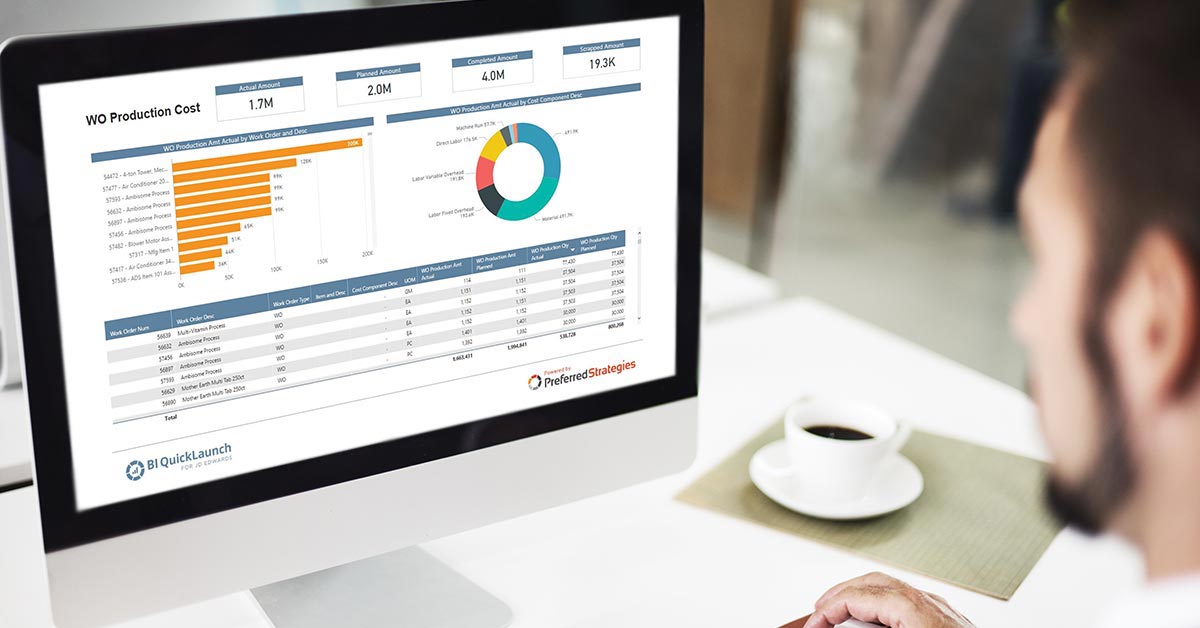
by Preferred Strategies
by Preferred Strategies
Complete the form on this page to access the virtual workshop.
By submitting this form, you agree to the Privacy Policy of our website.
There’s a goldmine of data inside your JD Edwards system. But data is just a series of ones and zeroes without the tools to turn it into information.
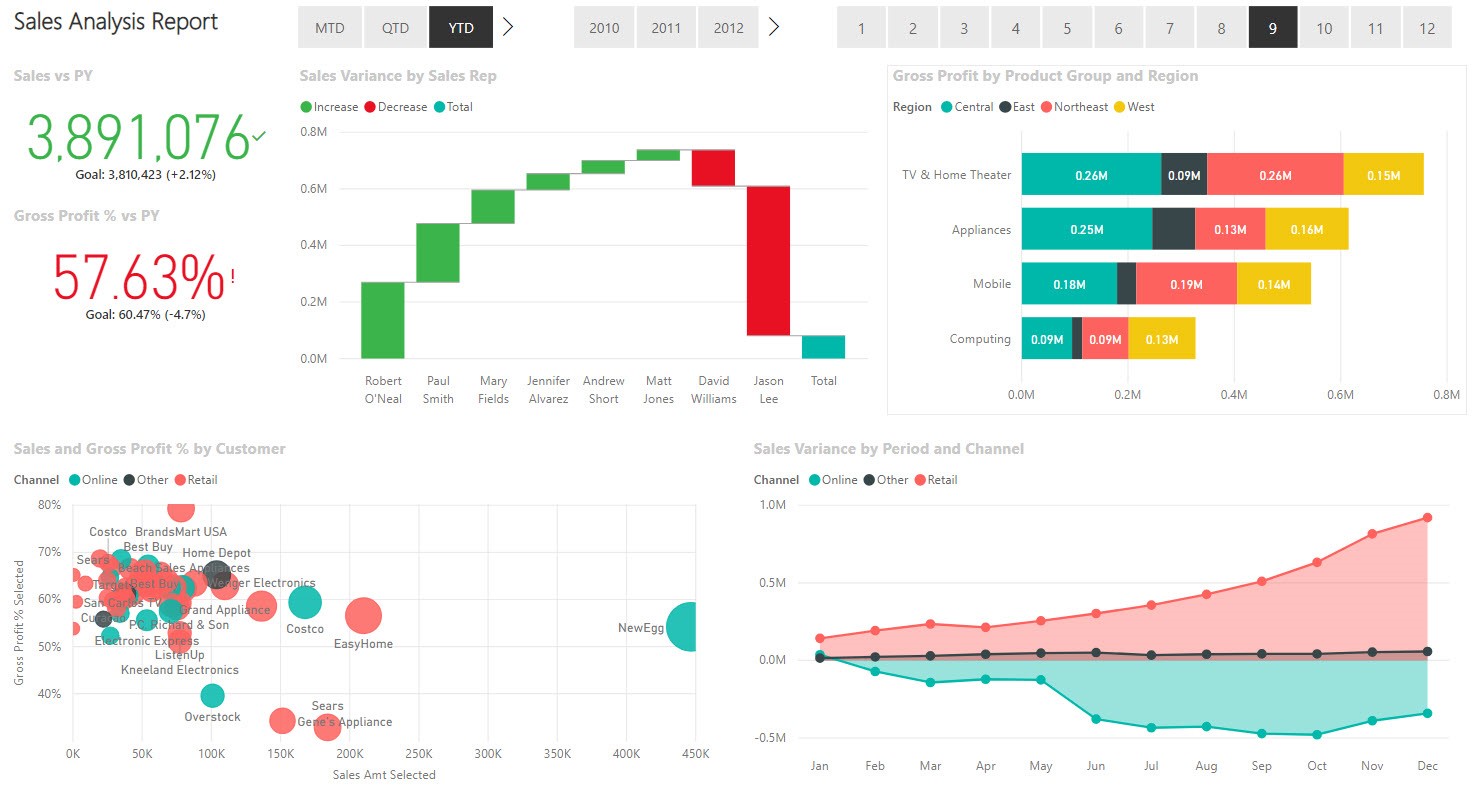
Watch this pre-recorded workshop to learn how to build interactive JD Edwards reports with Preferred Strategies QuickLaunch and Microsoft Power BI. Walk through a series of hands-on exercises to create reports for common JDE business scenarios. With Power BI in the cloud and sample sales data you'll learn how to build an interactive sales dashboards including key performance indicators (KPIs), sales variance analysis, and ways to analyze gross profit by product, customer, and more.
See how to:
Here's a sample of the type of dashboard we'll build during the workshop:
Objective 1: Connect to sample JD Edwards ERP data for reporting and analytics.
Objective 2: Learn about the modern; self-service approach to BI to easily create reports and dashboards for common business scenarios.