
Making the Grade with Modern Analytics
Using QuickLaunch & Power BI to Excavate Insights from Viewpoint Vista Data
Company Snapshot

Company:
Sukut Construction
Industry:
Heavy Civil Construction
Challenge:
Enable efficient corporate-wide reporting and data visualization and combine datasets from other core systems to streamline operations, spot trends, and improve profitability. Enable full-featured mobile reporting and analysis on the job site.
Solution:
Implement Preferred Strategies QuickLaunch for
Viewpoint Vista integrated with Microsoft Power BI.
Result:
The finance team can create reports and dashboards in a fraction of the time previously required, giving management the data needed to proactively manage the business.
Sukut Construction is a General Heavy Civil Engineering Contractor with over 50 years of superior performance on private, public, commercial and industrial projects throughout California. Sukut is a leading grading and excavating company in the state, and they own and maintain an equipment fleet of more than 200 heavy CAT Machines. In recent years, Sukut has received more than 30 industry honors, including “Contractor of the Year” and “Best Company to Work For.”
Drifting on the Data Lake
As a top-tier contractor, Sukut embraces modern technologies to improve operations. The company implemented the industryleading construction ERP system, Viewpoint VistaTM, about six years ago to centralize information and make it more easily available across the organization.
While the ERP system streamlined data access and improved operations in many ways, it was not a panacea. The business team still had to pull reports from multiple modules to monitor the status of a job. This process was time-consuming and prone to user error.
Adding to the team’s frustration was the knowledge that they had access to an enormous amount of valuable information in Vista, but weren’t using it to the company’s best advantage, nor could they easily combine data from other core systems with their Vista data to gain a more complete picture of the business. On top of that, senior management wanted a consolidated dashboard to monitor the business at a glance, plus mobile access to reports on the go or at the job site. So much data—but how to analyze it and present it in a useful, consumable way?
Dashboards Make the Difference
The Sukut team did not have the time or expertise to build an in-house solution. They evaluated several leading visualization tools and selected Microsoft® Power BI based on its features and market position. They soon discovered, however, that connecting the BI tool to Viewpoint Vista and building out meaningful reports was no simple task.
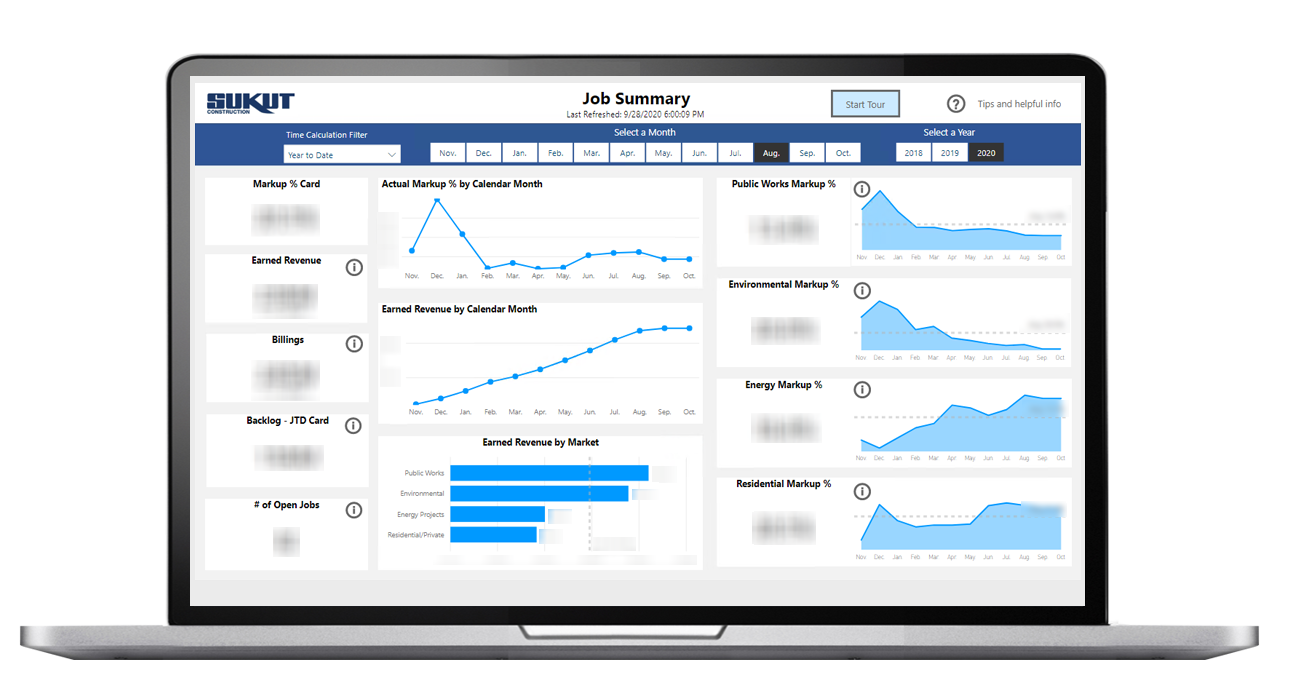
Sukut turned to Preferred Strategies to help realize their vision of turning their corporate data into a corporate advantage. Preferred Strategies QuickLaunch™ seamlessly connects Vista and other enterprise data to Power BI to enable selfservice analytics. Together the Sukut and Preferred Strategies teams first focused on building out tabular models and dashboards to support financial reporting. The finance staff used to make copies upon copies of reports and struggled to keep them up to date. Now they have consolidated, sharable reports and dashboards that update dynamically as the data changes. Better yet, management has access to Power BI KPI dashboards and can monitor the business at a glance—from the office or on the go—and drill down into specific details.
They initially thought they would only need a few Power BI licenses, but quickly grew to 10 users and anticipate they will soon have 40-50 users. “It took some time to build out the dashboards and reports we wanted, but once done, the upside is tremendous,” said Suzie Helmsworth, Cost and Systems Analyst at Sukut Construction. “Totally worth the investment.”
The team is now focused on the Job Cost dashboard. Logging into the ERP system from the field is completely impractical from a computer, and simply not possible from a mobile device. Sukut’s vision is for foremen to access Power BI reports and dashboards using iPads on the job site to increase efficiency and enable proactive decisionmaking. “Our president was blown away by the new dashboards—and that was even before they were complete!” said Steve Moua, Assistant Controller at Sukut Construction “This is clearly the future of reporting for the construction industry.”
Looking Forward
After Job Cost reporting is complete, Sukut plans to work on the Equipment module and apply similar dashboards for its other sister companies.
Equipment utilization is the lifeblood of heavy equipment—when it sits idle, the company loses money on its capital investment. It is essential to accurately track equipment usage, and to pre-position or transport equipment between job sites on a “just in time” basis to maximize the usage. Sukut currently tracks equipment assets with B2W Schedule, along with VisionLink and Samsara, and cannot easily combine this data with related Vista project data.
With QuickLaunch and Power BI, the team will be able to combine datasets to better analyze equipment utilization. For example, tracking fuel costs for an individual piece of machinery and correlating those expenses against actual run-time can surface discrepancies in reporting or idle equipment that could be used for other projects to reduce costs.
“The Equipment Management team will soon have real-time access in equipment information, telematics, and financial information combined from multiple sources to make important business decisions,” said Steve Moua. This is something that he sees will be a huge benefit to the Equipment Team since it requires gathering of multiple reports from multiple applications, similar to Job Cost.
Lessons Learned Along the Data Journey
A variety of factors have contributed to the team’s BI project success. First and foremost, the vision and support of the senior management team has engendered a culture that embraces the value of data-driven decision making. The dedication, persistence, and curiosity of the finance and IT staff have also been essential. They kept their eyes on the prize, knowing that they would be able to work more efficiently, spend less time on mundane tasks, and turn reports and dashboards around in a fraction of
the time previously required. They looked forward to being able to use their data in ways that were impossible before to make a real impact on the business: to explore the data, ask “what if” questions, and even make predictions about the future.
Partnering for Success
Working with a partner like Preferred Strategies helped Sukut to shorten the implementation cycle and to understand what they would be able to achieve with a modern BI and data environment. “The Preferred Strategies team has an exceptionally high level of expertise in what they do, and will go above and beyond for the client,” said Moua. “Their involvement has been critical to our success.”
Training has also been central to project success and user adoption. Sukut received training from Preferred Strategies as part of the implementation process, and plans to do more to increase the internal knowledge base and on-board new users. “Preferred Strategies has shown us how to get the most out of Power BI,” said Helmsworth.